At a time when the benchmark indices -- S&P BSE Sensex and NSE's Nifty50 -- are hovering around 37,200 and 11,000 levels and have remained mostly flat thus fgar in September, aviation stocks such as InterGlobe Aviation (parent company of IndiGo) and SpiceJet are showing a decent formation on the technical charts.
While InterGlobe Aviation is heading towards a new all time high, SpiceJet has managed to absorb selling pressure at around Rs 150 levels from April this year.
Here's how these two stocks look on the tehcnical charts:
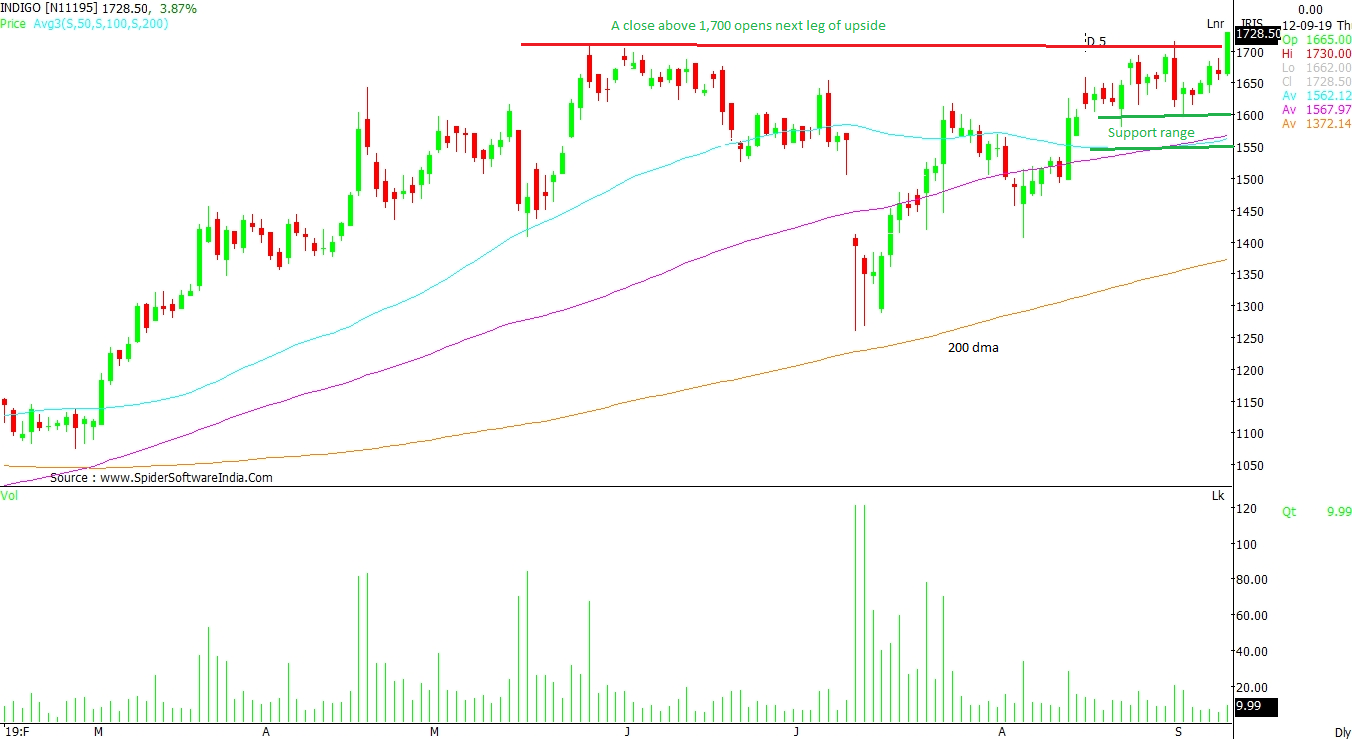
InterGlobe Aviation Ltd (INDIGO): After falling over 10 per cent in July, the counter has not seen any weakness since. The low of Rs 1,261 has become the lowest level and every minor correction has seen buying. The 200-day moving average (DMA) is the most significant support for the stock, which is currently placed above from January 2019 levels. At present, the range of Rs 1,600 – Rs 1,550 remains an immediate support and a rally towards Rs 1,800 – Rs 1,850 is possible. Although, the counter is struggling to close above Rs 1,700 levels, but the momentum is getting stronger on the upside. The overall trend seems positive as the counter has managed to trade near its resistance levels. CLICK FOR CHART VIEW
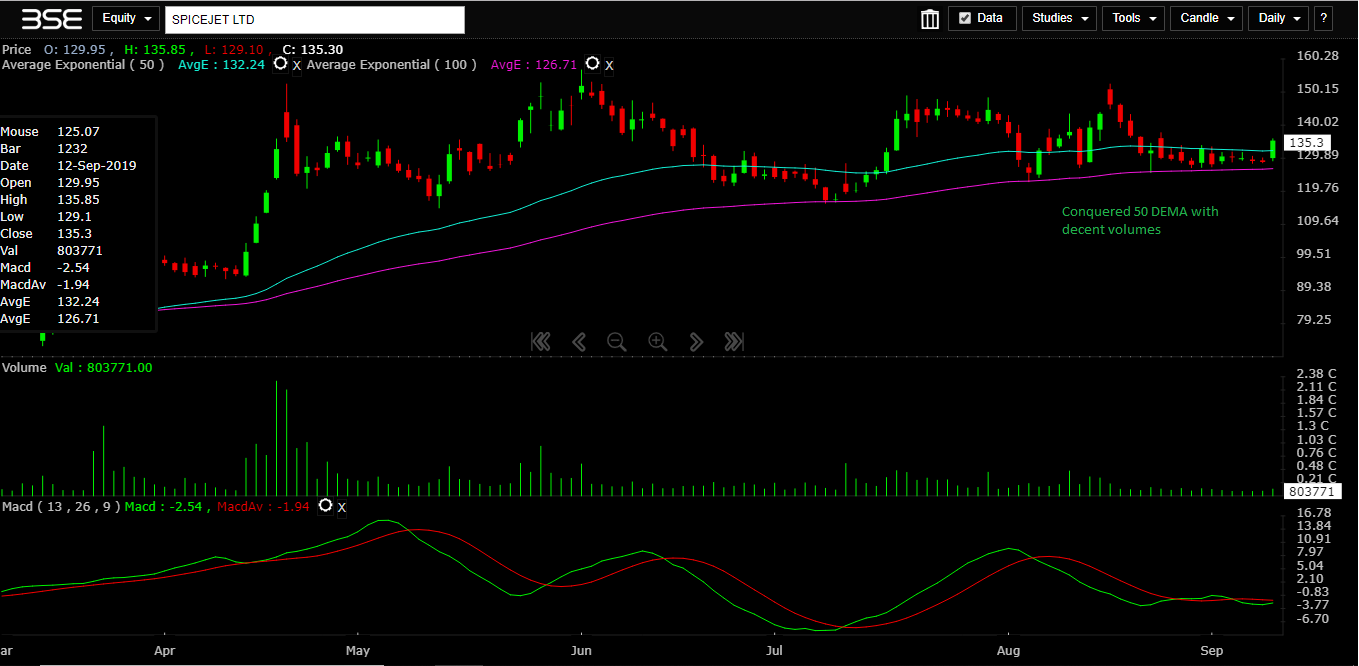
SpiceJet Limited (SPICEJET): The counter is forming 'higher highs, higher lows' pattern. It did correct, but did not lose the overall positive momentum entirely. SpiceJet is trading above 100-day exponential moving average (DEMA) currently placed at Rs 126.30, which is an immediate support for the stock. On Thursday, it conquered 50-Double Exponential Moving Average with above-average volumes, after consolidating in the range of Rs 133 – Rs 127, as per the daily chart. The Moving Average Convergence Divergence (MACD), though, trades with negative crossover. A positive close for one more session should trigger a further upside. The counter should likely test Rs 145 – Rs 152 in the coming sessions. CLICK FOR CHART VIEW
Read this article for free
Register to continue reading premium journalism and analysis from Business Standard.
 "InterGlobe Aviation and SpiceJet are ready to fly higher, show charts")


