We have spoken about job losses in this column earlier. But, the labour markets' problem is not just in this fall or even its composition, which is no less worrying. Arguably, a greater problem is the sharp fall we see in the number of people seeking jobs.
A fall in the number of people employed along with a fall in the number of people seeking jobs implies a fall in the labour force. Prima facie, this is worrisome. Why should the fastest growing large economy with a young population see a fall in the labour force?
The number of people who declared themselves to be unemployed and were willing to work and were also actively looking for jobs was 39 million in January 2016. Between January and September 2016, this estimate varied between 37 million and 44 million, with an average of nearly 40 million unemployed. It peaked in May 2016 to over 44 million. This, we believe was the time of the year when fresh graduates thronged the labour markets looking for jobs.
In October 2016, the number of unemployed dropped sharply to 30 million, from nearly 39 million in the preceding month. But, there was no corresponding increase in the number of people employed. This happened before demonetisation. We cannot tell (because we do not have long time-series data as the CMIE-BSE partnership to estimate unemployment started generating data only in January 2016) if this was a seasonal fall at the end of a busy kharif season.
Under normal circumstances the extraordinary fall of October 2016 should have reversed in a month or two. But, this did not happen. The count of unemployed has continued since October 2016. By July 2017, the number of people unemployed fell to 13.7 million. It is this persistent fall in the unemployed who are seeking jobs to nearly a third of its level a year ago that makes us focus on this problem now.
Why are the unemployed not even seeking jobs? It will require academics to undertake rigorous research targeted for publication in peer-reviewed journals of repute to answer the question thoroughly. Ingredients for such research (the record-level raw data) are available with CMIE.
Here, I make one observation as is evident from the broad aggregated data.
First, the data says that it is the young who are moving out of the labour force. It is the young who are losing jobs and it is the young again, who have stopped looking for jobs although they are unemployed.
We define the young as persons between 15 and 24 years of age.
We compare the January-April 2017 data against the September-December 2016 data. Over this period, the labour force shrunk by 11 million. Of this, 1.5 million were employed and the rest, that is a whopping 9.5 million were unemployed. We had spoken about the loss of 1.5 million jobs earlier (July 11, 2017). Now we try and understand a bigger problem -- the 9.5 million people who stopped looking for jobs with a particular focus on the young.
Of the 9.5 million unemployed who stopped looking for jobs, nearly seven million were young. Is it possible that the young decided to continue with studies rather than look for jobs. This is known to happen in developed countries -- during economic slowdowns, people seek to re-skill themselves. A similar phenomenon could be under play in India now. Young people faced with fewer jobs or less-paying jobs may just decide to pursue higher education instead of looking for presumably non-existent jobs.
Possibly, the youth are enrolling themselves into the various skilling programs being promoted by the government.
But, if the youngsters are not enrolling themselves into higher education or skilling programs then, we could have a problem growing in our midst.
The fall in the count of unemployed is concentrated in Uttar Pradesh, Bihar, Jharkhand and Odisha. These are the less developed states and these are also the states with the greatest bulge in young population. Such youngsters, who have no jobs and have even stopped looking for jobs could easily stray into unlawful activities. The demographic dividend can become a demographic demon.
The need for rigorous research in this area cannot be understated. We do not have to wait for another round of data collection on employment and unemployment. Such an exercise could take anywhere between 3 to 5 years to provide any meaningful insight. We need to call in the academics, use the existing machinery in the government and in the private sector to help in understanding the employment/unemployment scene in India and take corrective actions wherever necessary.
Every Tuesday, Business Standard brings you CMIE’s Consumer Sentiments Index and Unemployment Rate, the only weekly estimates of such data. The sample size is bigger than that surveyed by the National Sample Survey Organisation. To read earlier reports on the weekly numbers, click on the dates:
Consumer sentiment indices and unemployment rate are generated from CMIE's Consumer Pyramids survey machinery. The weekly estimates are based on a sample size of about 6,500 households and about 17,000 individuals who are more than 14 years of age. The sample changes every week but repeats after 16 weeks with a scheduled replenishment and enhancement every year. The overall sample size run over a wave of 16 weeks is 158,624 households. The sample design is of multi-stratrification to select primary sampling units and simple random selection of the ultimate sampling units, which are the households.
The Consumer Sentiment index is based on responses to five questions on the lines of the Surveys of Consumers conducted by University of Michigan in the US. The five questions seek a household's views on its well-being compared to a year earlier, its expectation of its well-being a year later, its view regarding the economic conditions in the coming one year, its view regarding the general trend of the economy over the next five years, and finally its view whether this is a good time to buy consumer durables.
The unemployment rate is computed on a current daily basis. A person is considered unemployed if she states that she is unemployed, is willing to work and is actively looking for a job. Labour force is the sum of all unemployed and employed persons above the age of 14 years. The unemployment rate is the ratio of the unemployed to the total labour force.
The creation of these indices and their public dissemination is supported by BSE. University of Michigan is a partner in the creation of the consumer sentiment indices.
Read this article for free
Register to continue reading premium journalism and analysis from Business Standard.
Disclaimer: These are personal views of the writer. They do not necessarily reflect the opinion of www.business-standard.com or the Business Standard newspaper
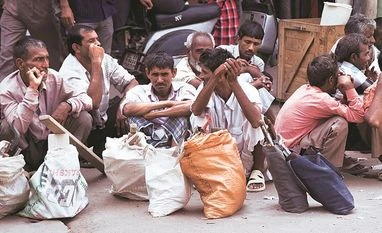 "Young, unemployed and not looking for jobs spells trouble for the economy")


