Breakout alert: This Adani group stock can gain 30%; buy or sell the rally?
Adani Power was seen testing resistance at its 200-DMA after more than six months. The stock needs to break above ₹610 for a likely fresh upside rally, suggests the technical chart.
Rex Cano Mumbai Shares of Adani Group-based energy firm -
Adani Power have gained 13.6 per cent thus far in April; and the stock soared over 26 per cent from its low of ₹462 hit on April 7, to the day's high at ₹584 on Wednesday.
The stock traded with a gain of 0.8 per cent at ₹577, while the NSE benchmark
Nifty 50 index rose 0.4 per cent at 24,250 levels.
The recent gains in the stock have been attributed to growing investor interest in the power sector owing to rising demand for electricity this summer. That apart, analysts are optimistic that the company will be able to deliver steady earnings growth in the March quarter. Adani Power is scheduled to announce its Q4FY25 results on April 30, 2025.
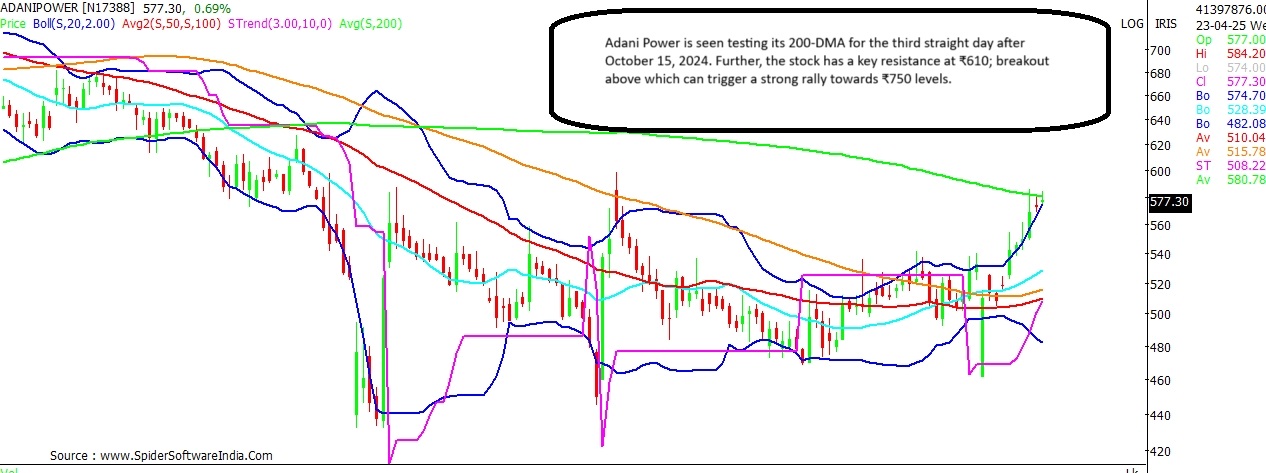
Technically, Adani Power stock was seen testing resistance at its 200-day Daily Moving Average (200-DMA) for the third straight day on Wednesday. The stock last closed above this key long-term moving average on October 15, 2024.
CLICK HERE FOR THE CHART Further, stock is also seen within striking distance of the weekly super trend line resistance which stands at ₹610 - a key medium term indicator.
Against this background, here's what your trading strategy should be at the counter.
ALSO READ: 5 smallcap stocks to buy with up to 25% upside potential; check full list Adani Power
Current Price: ₹577
Upside Potential: 30%
Support: ₹549; ₹530; ₹515
Resistance: ₹610; ₹655; ₹685
Adani Power daily chart shows that the near-term bias for the stock is likely to remain positive as long as the stock holds above ₹549 levels. Below which, strong support for the stock can be anticipated at ₹530 and ₹515 levels.
ALSO READ | Waaree Energies jumps 19% in trade; here's why the stock is in demand today Key momentum oscillators on the weekly scale are favourably placed; hence any dip at the counter could be a buying opportunity in the stock. On the upside, the stock needs to conquer the hurdle at ₹610 for likely further gains.
The long-term chart suggests that the stock can potentially soar towards ₹750 levels. On its way up, the stock may face interim resistance around ₹655 and ₹685 levels.
 "Breakout alert: This Adani group stock can gain 30%; buy or sell the rally?")
