IFCI stock has zoomed almost 90 per cent in the last three weeks. The stock from levels of ₹39.24 on May 9 has rallied to a high of ₹74.50 on Thursday, May 29.
The stock had hit a life-time high of ₹91.40 in July 2024, which at present is also the 52-week high. Whereas, the 52-week low of the stock stands at ₹35.67.
Amid the present rally, the stock has conquered key moving averages across time-frames. IFCI stock is now seen trading above its long-term 200-Day Moving Average (200-DMA) on a consistent basis, after a gap of nearly 5 months. The rally in IFCI stock price has been backed by strong volumes, the average trading volume at the counter has more-than-doubled in the last five trading sessions.
The company in a clarification to the exchange said the recent rally in
IFCI share price was completely market driven.
Meanwhile, IFCI showed improvement in the company's financials with a dip in Non-Performing Asset (NPA) levels, and not taking any new loans.
READ MORE Against this background, can IFCI stock extend the rally and hit the ₹100-mark? Here's what the technical chart suggests.
ALSO READ | HUL, Kaveri Seeds among 5 stock picks this monsoon; check upside potential IFCI
Current Price: ₹72
Upside Potential: 40.3%
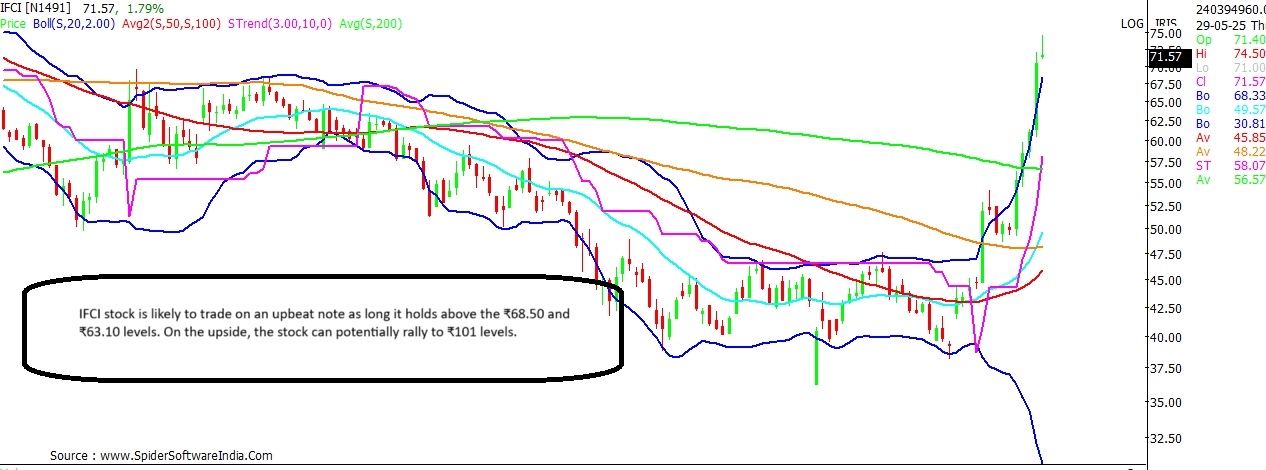
Support: ₹68.50; ₹63.10
Resistance: ₹77.20; ₹86.40; ₹93.85
Technical chart shows that IFCI stock has given a strong breakout on the daily chart, and is on the verge of confirming a breakout on the weekly scale too. A close above ₹55.40 this Friday, shall confirm the weekly breakout.
For now, the near-term bias at the counter is likely to remain upbeat as long as the stock trades above ₹68.50 levels; below which notable support for the stock can be expected around ₹63.10 levels.
CLICK HERE FOR THE CHART On the upside, IFCI stock can potentially surge to ₹88 levels in the near-term shows the monthly chart. The yearly Fibonacci chart indicates that the stock can potentially zoom to ₹101 levels. Key resistance for the stock this year are placed at ₹77.20, ₹86.40 and ₹93.85 levels.
 "Can IFCI share price hit ₹100-mark in coming days? Trading strategy here")


