Home / Markets / News / Coforge, Vesuvius stocks to turn ex-split in June; how to trade? Read here
Coforge, Vesuvius stocks to turn ex-split in June; how to trade? Read here
Coforge and Vesuvius have rallied up to 29% post announcement of stock split; technical charts suggest these 2 stocks could rally another 16% from present levels.
Coforge, Vesuvius India to trade ex-split in June.
3 min read Last Updated : May 15 2025 | 11:29 AM IST
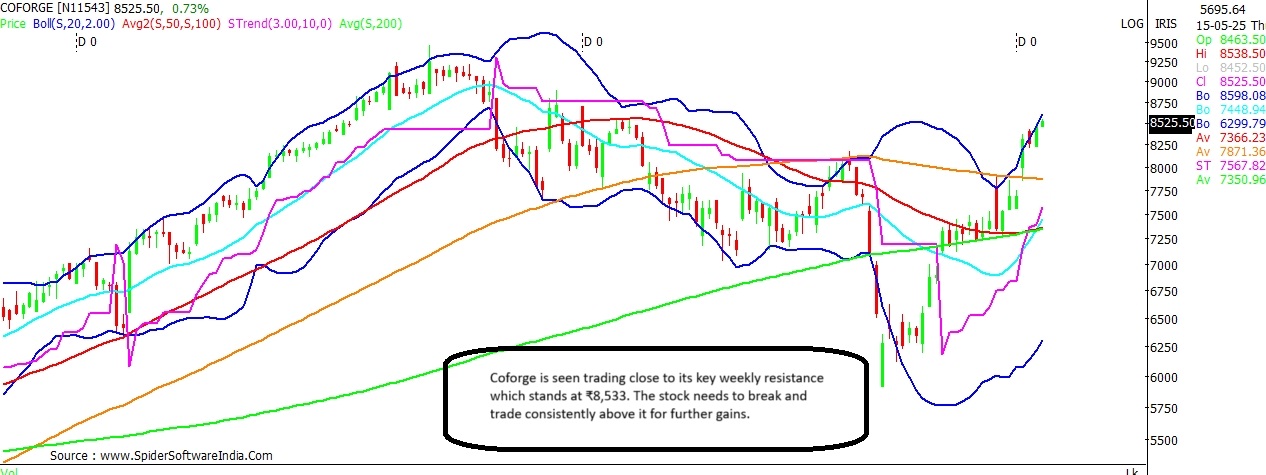
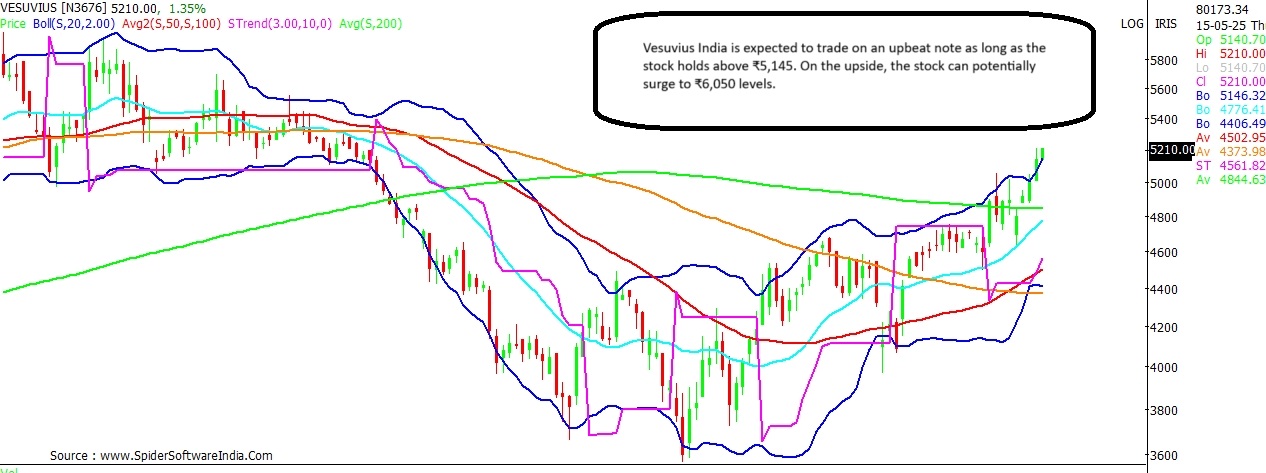
Shares of Coforge and Vesuvius India are likely to be in focus in the fortnight ahead as they approach the respective record date for turning ex-stock split. Coforge, on March 4, announced stock split in the ratio 1:2; wherein each share of the MidCap IT company with a face value of ₹10 will be sub-divided into 5 equity shares with a face value of ₹2 each. The company has set June 4 as the record date to ascertain eligible shareholders for the proposed corporate action. Meanwhile, Vesuvius India notified a 1:10 stock split on February 26; wherein each share with a face value of ₹10 will be sub-divided into 10 equity shares with a face value of ₹1 each. The record date has been fixed as June 10. Post the respective stock-split announcements, Coforge has gained 10.3 per cent thus far, while Vesuvius India has rallied 29 per cent to a high of ₹5,215 hit today. Against this background, with less than a month to go for the stock split, here's a trading guide based on the technical analysis of these 2 stocks. ALSO READ | REC, NTPC, Powergrid: Are power stocks losing steam? Here's what charts sayCoforge Current Price: ₹8,501 Upside Potential: 14.7% Downside Risk: 10.6% Support: ₹8,230; ₹7,870 Resistance: ₹8,533, ₹8,625, ₹8,730, ₹9,120; ₹9,435 The price-to-moving averages action is indicating a mixed bias for Coforge, as select short-term moving averages (20-Day Moving Average and the 50-DMA) are below the medium-term moving average (100-DMA). However, key momentum oscillators both on the daily and weekly chart are clearly in favour of the bulls. At present levels, the stock is seen trading within striking distance of the weekly super trend line resistance at ₹8,533. The stock needs to break and trade consistently above the same for further gains to emerge. On the upside, the stock can potentially rally to ₹9,750 levels, with interim resistance likely around ₹8,625, ₹8,730, ₹9,120 and ₹9,435 levels. On the other hand, key support for the stock stands at ₹8,230. Break and sustained trade below the same can trigger a fall towards ₹7,600 levels, with interim support likely around ₹7,870 - wherein stands the 100-DMA. CLICK HERE FOR THE CHARTVesuvius India Current Price: ₹5,200 Upside Potential: 16.4% Downside Risk: 6.8% Support: ₹5,145; ₹5,010 Resistance: ₹5,350; ₹5,480; ₹5,740 Vesuvius India stock is expected to trade on an upbeat note as long as the stock holds above ₹5,145 levels. Below significant support for the stock is visible at ₹5,010 and ₹4,845 levels. On the upside, the stock could rally towards the higher-end of the Bollinger Bands on the monthly chart, indicating an upside target of ₹6,050 levels. Interim resistance for the stock can be anticipated around ₹5,350, ₹5,480 and ₹5,740 levels. CLICK HERE FOR THE CHART
 "Coforge, Vesuvius stocks to turn ex-split in June; how to trade? Read here")
