IndusInd Bank up 36% from April low. Buy, sell, hold? Check strategy here
Technically, the short-term trend for IndusInd Bank looks favourable; but chart cautions that stock may face challenges around its 100-DMA, and the weekly trend line resistance. Check key levels here
Rex Cano Mumbai IndusInd Bank stock surged over 3 per cent to ₹ 864 in intra-day deals on Friday, and was the top gainer among banks in the Sensex that gained nearly a per cent to hit the 81,000 mark. On the other hand, In comparison, the Nifty Bank index was trading around 0.8 per cent higher in intraday trade at 55,508 levels.
IndusInd Bank stock has zoomed nearly 36 per cent from its April-month low of ₹ 637.
IndusInd Bank has been in the news amid
resignations of the top management. The bank's Managing Director (MD) and Chief Executive Officer (CEO) Sumant Kathpalia, and Deputy Chief Executive Officer Arun Khurana had resigned last week.
The
Reserve Bank of India (RBI) then approved the formation of a temporary leadership team at IndusInd Bank. The developments follow accounting lapses that triggered a sharp fall in the stock in April.
DETAILS HERE Given this background, what should be your trading strategy in IndusInd Bank stock? Should you buy, sell or hold IndusInd Bank stock? Here's what the technical chart suggests.
ALSO READ | Is Kalyan Jewellers stock ready for its next big move? Find out here IndusInd Bank
Current Price: ₹ 859
Upside Potential: 9.9%
Downside Risk: 12.7%
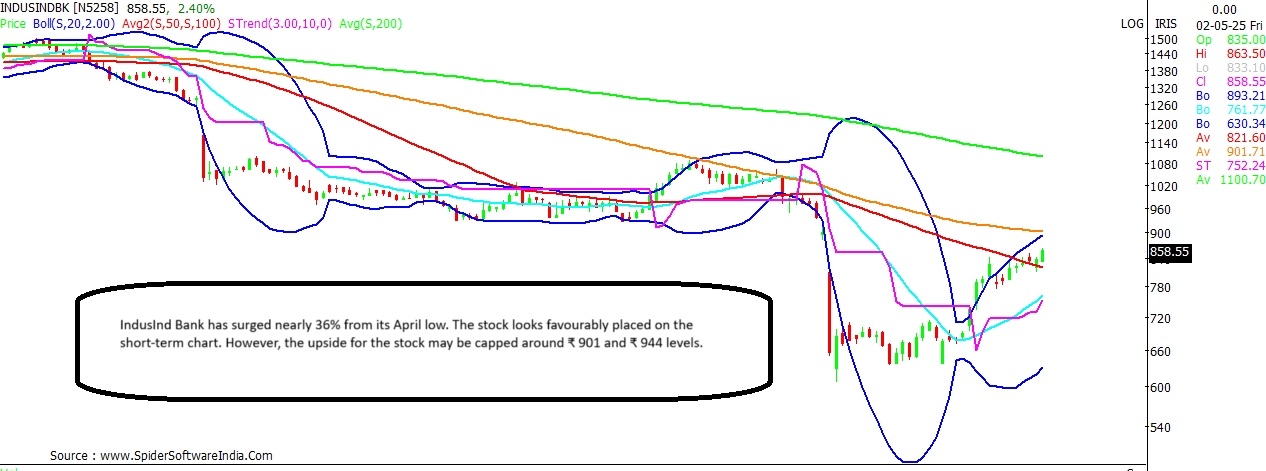
Support: ₹ 822; ₹ 763
Resistance: ₹ 901; ₹ 944
IndusInd Bank stock is seen trading above its 50-Daily Moving Average (50-DMA), which stands at ₹822, for the last three trading sessions. That apart, the stock also trades firmly above its 20-DMA (₹ 763), and saw a positive breakout in mid-April above ₹ 740 levels - since then the stock has gained 16.5 per cent in the last 11 trading sessions.
Technically, the stock short-term bias for the stock is expected to remain positive as long as the stock sustains above ₹ 750 - ₹ 763 support zone. However, chart shows that the stock may see limited gains on the upside owing to presence of major hurdles.
CLICK HERE FOR THE CHART ALSO READ | PNB Housing surges 8% after block deal; this shareholder exits company The stock is now seen nearing its crucial 100-DMA resistance, a key hurdle the stock has been languishing below for the last seven months. The 100-DMA resistance now stands at ₹ 901 levels. Above which, the up side for the stock seems capped around ₹ 944 levels - wherein stands the weekly super trend line hurdle - a key indicator the stock has failed to conquer for more than a month.
 "IndusInd Bank up 36% from April low. Buy, sell, hold? Check strategy here")
