Technical charts show that the RSI indicator of BEL and Tata Steel quotes in overbought territory, with a reading in excess of 70. Here's the likely trend ahead for these 2 stocks.
The 14-day RSI indicator helps in determining overbought and oversold stocks. (Representative Image)
Bharat Electronics (BEL) and Tata Steel from the Nifty 50 space have surged up to 22 per cent and 16 per cent thus far in the month of May 2025. BEL stock, in fact, has zoomed 58 per cent in the last three months from a close of ₹245 in February to a new life-time high of ₹286.75 on the NSE in Thursday's trading session. In the process, both these stocks - BEL and Tata Steel are technically seen trading in overbought territory on the charts. The 14-day Relative Strength Index (RSI) - a key momentum indicator that helps in assessing if the underlying stock or index is overbought or oversold. The 14-day RSI indicator is plotted on a scale of 0 - 100. In stock markets, a RSI reading above 70 is considered an overbought zone, whereas a reading below 30 is considered oversold. At present, BEL 14-day RSI stands at 84.7, and Tata Steel at 72.8 levels. Follow Stock Market Latest Updates Today LIVE Analysts, in general, caution against venturing into stocks that are trading in an overbought zone, as they may tend to fall sharply in the case of adverse market reaction. Having said that, stocks can remain in overbought and oversold zone for longer-time, and other key momentum indicators need to be tracked in coordination with the RSI to determine a likely change in trend. Here's how BEL and Tata Steel are placed on the charts, check key levels here:
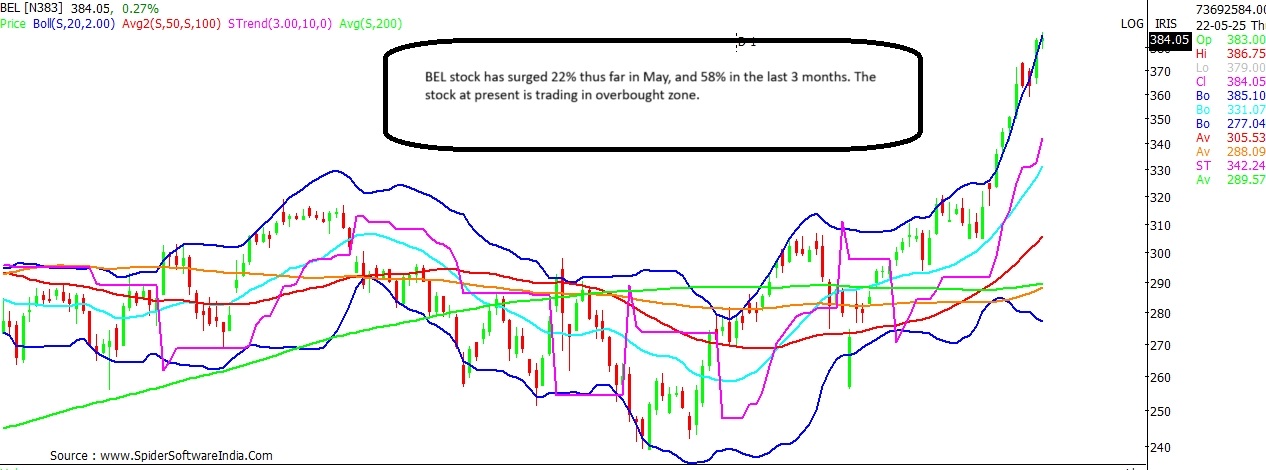
Bharat Electronics (BEL)
Current Price: ₹382 Upside Potential: 15.2% Support: ₹360; ₹355 BEL witnessed a breakout earlier this month following a prolonged 10-month time-wise consolidation within the broad range of ₹240–₹340. The breakout above ₹340 confirmed a fresh bullish setup, with a projected technical target of ₹440, says Kunal Kamble, Sr. Technical Research Analyst at Bonanza. CLICK HERE FOR THE CHARTALSO READ | These 2 smallcap stocks see Golden Crossover on charts; can rally up to 21% However, the stock is currently trading in the overbought zone on the daily timeframe. Investors are advised to consider adding the stock on dips near the ₹355–₹360 range, which aligns with the 9-period EMA, while maintaining a stop loss at ₹340 for an anticipated upside toward ₹440, the analyst adds.
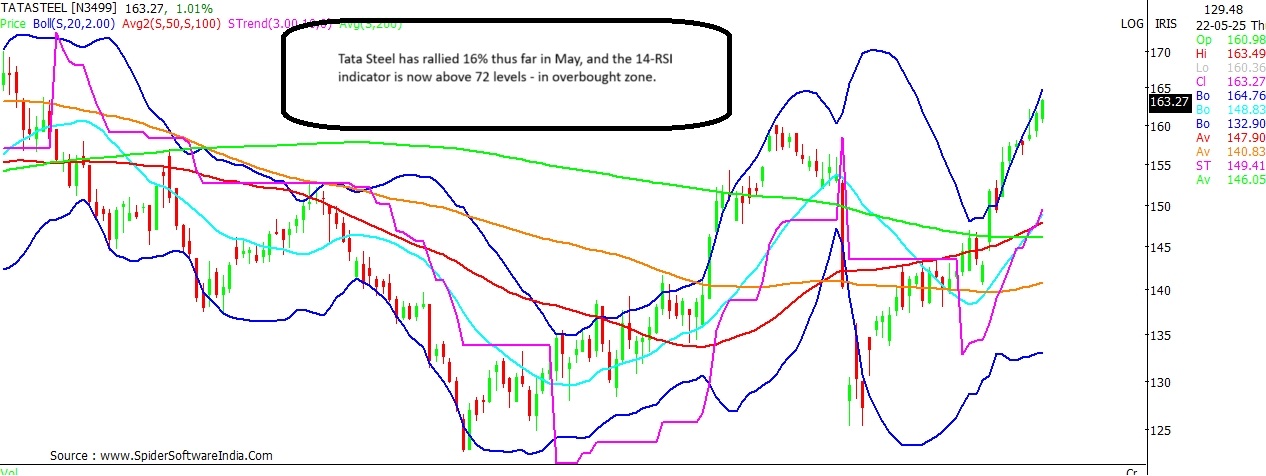
Tata Steel
Current Price: ₹163 Upside Potential: 10.4% Support: ₹152 Tata Steel continues to trade with upward momentum, aligning with the strength seen in the Nifty Metal index. On the daily timeframe, the stock is approaching the overbought zone, as reflected by the Relative Strength Index (RSI). CLICK HERE FOR THE CHARTALSO READ | How to trade Vodafone Idea, Airtel, TTML after SC dismisses AGR dues plea? Despite this, the broader trend remains strong on higher timeframes, with potential upside targets of ₹170 and ₹180. As long as the stock holds above ₹152—aligned with its 20-day EMA—existing investors can maintain their positions. However, fresh entries are not advised at current levels due to an unfavorable risk-reward ratio, explains Kunal Kamble.
 "Nifty stock alert! BEL, Tata Steel trade in overbought zone; warning sign?")