Shares of Indian Bank jumped over 2 per cent to register a new all-time high of ₹644.95 on the Bombay Stock Exchange (BSE) in Monday's trade on the back of strong volumes. As of 2 PM, the counter had seen trades of around 2.12 lakh shares as against the two-week average volume of around 83,000 shares on the BSE.
In the process, Indian Bank stock has surged nearly 19 per cent so far this calendar year (2025); and rallied as much as 36 per cent from a low of ₹474, which is also the 52-week low, registered on January 13, 2025.
The rally at the
Indian Bank counter is seen in-line with gains in other PSU Bank shares. The Nifty PSU Bank index surged 2 per cent in intra-day deals today, even as the benchmark National Stock Exchange (NSE) Nifty 50 index quoted 0.3 per cent lower.
The buying interest in PSU banks was attributed to the upcoming Reserve Bank of India (RBI) Policy meeting this week, wherein the central banker is expected to cut interest rates by another 25 basis points. That apart, a strong GDP growth coupled with soft inflation numbers have been bolstering future economic growth prospects for India.
READ MORE Against this background, here's a technical outlook Indian Bank stocks.
Indian Bank
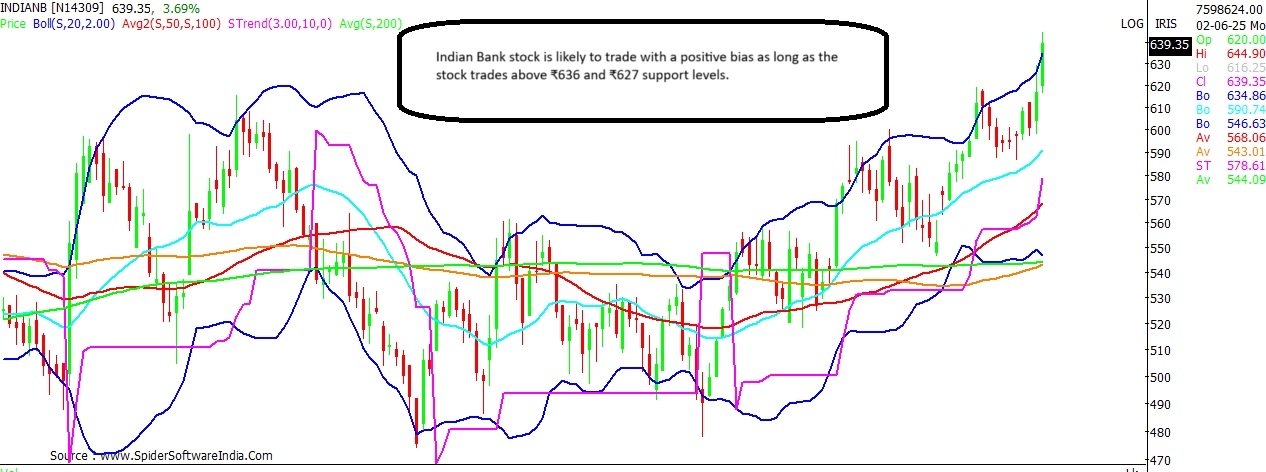
Current Price: ₹641
Upside Potential: 17%
Downside Risk: 7.8%
Support: ₹636; ₹627; ₹591
Resistance: ₹666; ₹702
Indian Bank stock, at present, is seen trading above the higher-end of the Bollinger Bands on the daily and weekly scale. Technical chart suggests that the bias for Indian Bank stock is likely to remain upbeat as long as the stock trades above ₹636 and ₹627 support levels.
CLICK HERE FOR THE CHART Further, the stock is seen making higher-highs and higher-lows on the daily scale; as such the 20-Day Moving Average (20-DMA), which now stands at ₹591, is expected to act as a bullish pivot for now.
On the upside, the stock seems on course to test ₹666 levels, as per the yearly Fibonacci chart. Breakout and sustained trade above the same can potentially open the doors for an extended rally towards ₹750, with interim resistance likely around ₹702 levels.
 "This PSU bank stock hit all-time high today; up 19% this year, what next?")


