Gold at $2,900: Should you buy or sell Muthoot, Manappuram Finance shares?
Technical chart suggest that Muthoot Finance, Manappuram Finance and IIFL may witness some downward pressure in the near-term, and dip up to 17%; check key levels to track here.
Rex Cano Mumbai Gold prices have rallied up to 11 per cent in international markets, and now quote at a record $2,900 per ounce, owing to uncertainty of the likely impact of tariff threats by the US president Donald Trump.
Experts believe that the current rally in Gold prices has been led by tariff threats by Trump, which in turn have seen investors move away from equities to safer havens.
READ MORE In India, Gold prices quoted around Rs 85,000 per 10 grams on the Multi Commodity Exchange (MCX).
Meanwhile, on the stock exchanges, shares of gold financers or gold loan lending companies have witnessed a mixed trend thus far in 2025. Shares of Manappuram Finance and Muthoot Finance have gained nearly 9 per cent and 3 per cent, respectively; while that of IIFL Finance shed almost 14 per cent.
In comparison, the National Stock Exchange (NSE) benchmark - the
Nifty 50 index has slipped 1.1 per cent, while the broader Nifty 500 index has declined 4.5 per cent.
On Tuesday, shares of these 3 gold loan lenders were seen trading with losses up to 3 per cent in a weak market. The Nifty 50 index was down 0.5 per cent around 23,270 levels.
Against this background, what should be your trading strategy towards shares of gold financers? Here's a trading guide based on the technical charts.
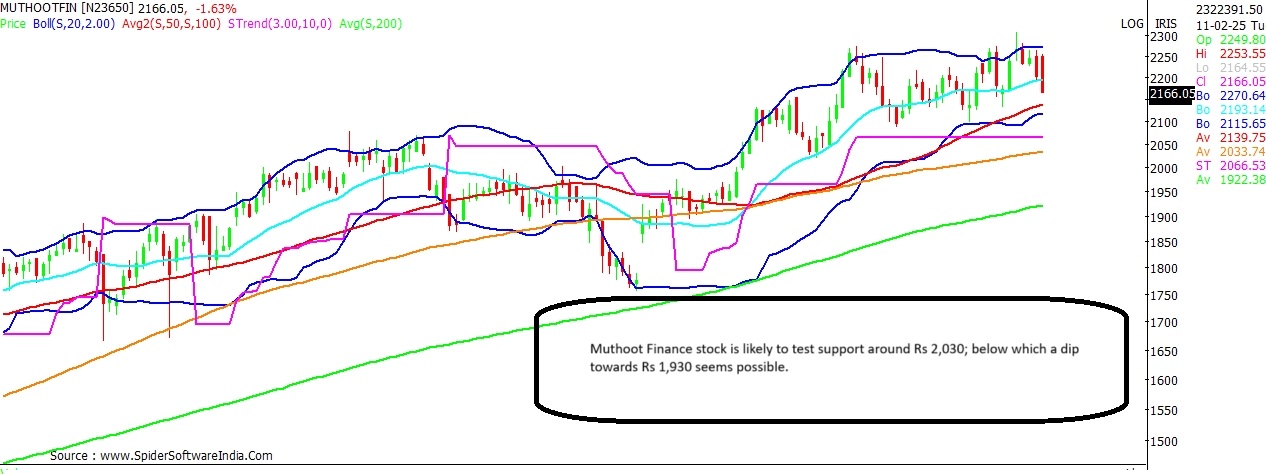
Muthoot Finance Current Price: Rs 2,180
Downside Risk: 11.5%
Support: Rs 2,193; Rs 2,030
Resistance: Rs 2,270
Muthoot Finance stock has been trading with a positive bias post the breakout in mid-November 2024. The stock from levels of Rs 1,776 rallied to a high of Rs 2,309 earlier this month. Post which, the stock is seen testing support around its 20-DMA (Daily Moving Average) at Rs 2,193 levels.
CLICK HERE FOR THE CHART Key momentum oscillators on the daily chart are showing signs of a likely negative crossover; hence the stock may witness some downward pressure in the near-term. Chart hints that the near-term bias may remain tepid as long as the stock trades below Rs 2,270. On the downside, the stock may revisit support at Rs 2,030 levels; break and trade below the same can trigger a slide towards Rs 1,930.
ALSO READ: Breakout stock: Telecom major MTNL can gain 86% to Rs 100; check levels Manappuram Finance Current Price: Rs 200
Downside Risk: 7%
Support: Rs 197; Rs 194
Resistance: Rs 210
Manappuram Finance stock has surged over 53 per cent in the last four months, from levels of Rs 137 to a high of Rs 210 recently. The stock at present is seen seeking support around its 20-DMA at Rs 197; with key momentum oscillators showing signs of exhaustion. Hence, the stock may consolidate in the near-term. As such, Manappuram Finance drop towards Rs 186 levels, with some interim support at Rs 194. The recent high at Rs 210 is likely to act as a hurdle.
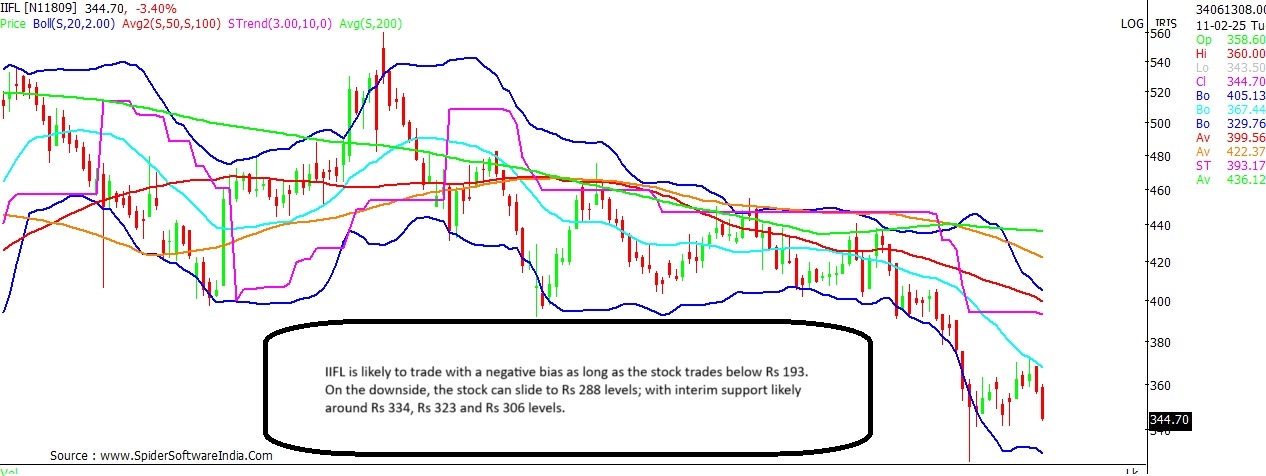
CLICK HERE FOR THE CHART IIFL Current Price: Rs 345
Downside Risk: 16.5%
Support: Rs 334; Rs 323; Rs 306
Resistance: Rs 393
IIFL has been trading with a negative bias across time-frames. The stock seems on course to test the long-term support at Rs 288; with interim support seen placed at Rs 334, Rs 323 and Rs 306 levels. The near-term bias for the stock is likely to remain negative as long as the stock trades below Rs 393.
CLICK HERE FOR THE CHART  "Gold at $2,900: Should you buy or sell Muthoot, Manappuram Finance shares?")