The
NSE Nifty 50 index surged over 1 per cent in intra-day deals on Friday to hit a high of 24,589 - its highest point in calendar year 2025. The index, however, trimmed gains as trade progressed as investors took profits off the table.
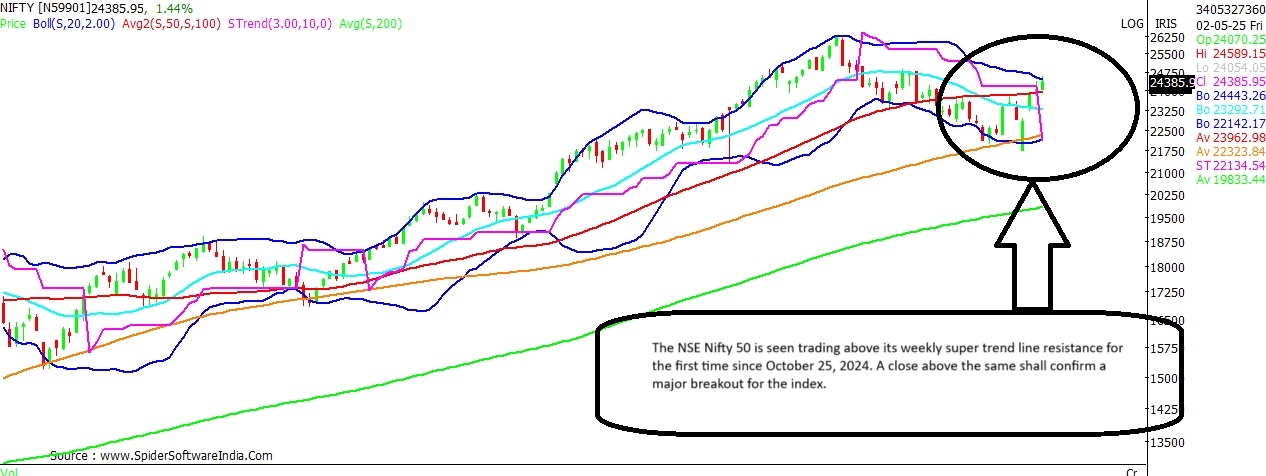
The Nifty has rallied by 13 per cent from its April 7 low of 21,744 in less than a month. In doing so, the Nifty this Friday stands on the brink of a major technical breakout on the charts after 28 weeks - i.e. since October 25, 2024.
The Nifty is seen quoting firmly above its weekly super trend line resistance, which stands at 24,169 - a key technical indicator the NSE benchmark has been languishing below for the last 28 weeks. A close above 24,169 today shall confirm the breakout on the weekly chart.
The weekly super trend line is a key technical indicator as it helps in determining the medium-term trend of the underlying index or stock. In general, stocks or indices quoting above this key indicator are said to be trading with a positive bias, and vice versa.
ALSO READ: Is it a good time to buy stocks? Chris Wood of Jefferies answers Given this background, here's what likely may happen in the event of a successful breakout on the Nifty.
Nifty Current Level: 24,440
Upside Potential: 6%
Support: 24,051; 23,550; 23,300
Resistance: 24,800; 24,980; 25,200
Technically, a breakout on the weekly scale for the Nifty shall open the doors for a likely rally towards 25,900 levels; above which a new high cannot be ruled out. Chart shows the index could face interim resistance around 24,800, 24,980 and 25,200 levels.
CLICK HERE FOR THE CHART The short-term bias for the index is expected to remain favourable as long as the index holds above 23,550, with near support anticipated around the 200-Day Simple Moving Average (200-DSMA) at 24,051 levels. Whereas, the medium-term chart indicates strong support for the index at 23,300 levels.
ALSO READ: IndusInd Bank up 36% from April low. Buy, sell, hold? Check strategy here Sensex Current Level: 80,700
Upside Potential: 6.7%
Support: 79,190; 78,150; 77,400
Resistance: 82,000; 82,400; 83,770; 84,240; 84,860
With today's high at 81,173, the
BSE Sensex has triggered a 'Buy' signal on the quarterly Fibonacci chart, by surpassing its quarterly Resistance-2 (R-2). Technically, the Sensex shall now target the R-3 level, which stands at 82,000-mark.
The 82,000-mark, may offer stiff resistance in the near-term, as it coincides with the yearly hurdle at 81,900 levels. Break and sustained trade above the same, can potentially trigger a rally towards 86,100 levels. Interim resistance for the index can be anticipated around 82,420, 83,770, 84,240 and 84,860 levels.
The near-term bias for the Sensex is expected to remain favourable as long as the index holds above 79,170 levels; below which the Sensex shall seek support around 78,150 and 77,400 levels.
 "Nifty can see a BIG BREAKOUT from here on; charts hint at this target")