Equity benchmark indices in India were seen trading with losses of over 1 per cent for the second straight trading session on Friday on the back escalating global conflicts, mainly Israel-Iran and uncertainty over the US tariff policies.
The Bombay Stock Exchange (BSE) benchmark index was down 1,264 points or 1.6 per cent at 80,428 levels in early deals today; while its counterpart the National Stock Exchange (NSE) Nifty 50 index shed 415 points or 1.7 per cent at 24,473.
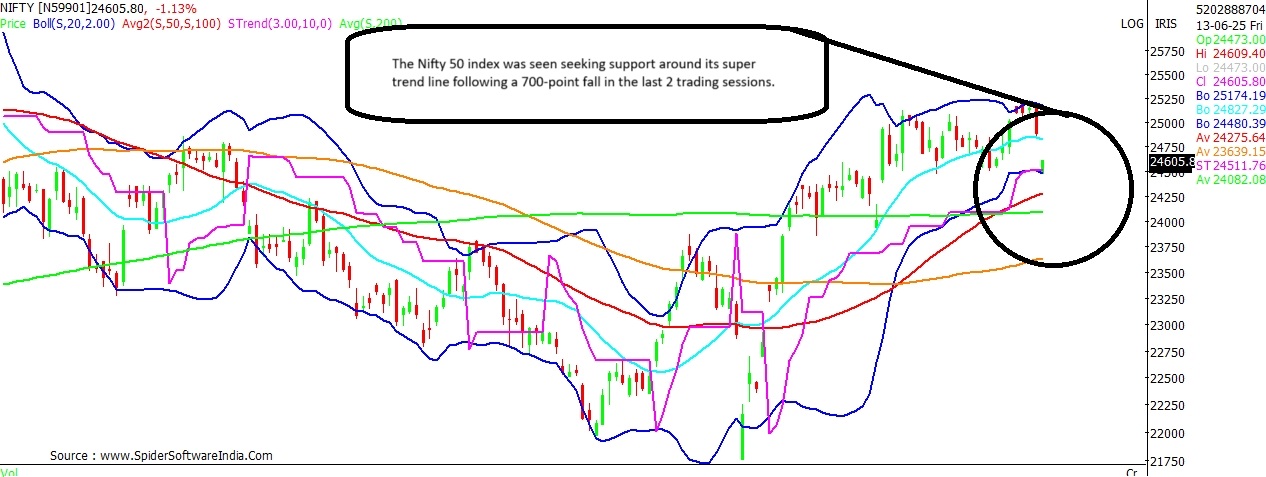
In the process, the
BSE Sensex had tumbled 2,087 points or 2.5 per cent in the last two straight trading sessions; whereas, the Nifty shaved-off 738 points or 2.9 per cent in the same period.
Technically, the NSE Nifty 50 index had witnessed two positive developments on the charts in recent days. Firstly, the Nifty had given a
breakout on the weekly scale in early May - following which the index surged over 1,183 points or 4.9 per cent to a high of 25,222 this week.
Secondly, the Nifty witnessed a
'Golden Crossover' on the daily chart on June 5, 2025. The index post then was up 471 points or 1.9 per cent at the recent high on June 11.
Follow Stock Market Latest Updates Today LIVE Does the present 3 per cent market correction derail the Nifty bullish set-up? Here's what the chart says.
Nifty
Current Level: 24,500
Support: 24,512; 24,380
Resistance: 25,050; 25,200
At present, the
Nifty 50 index has slipped below its 20-Day Moving Average (20-DMA), which stands at 24,850 levels. The index is now seen testing support around its super trend line support on the daily chart at 24,512. Technically, the near-term bias for the NSE benchmark index is likely to remain positive as long as the index holds above this trend line support on a closing basis.
CLICK HERE FOR THE CHART The Nifty chart shows that the present uptrend started with a gap-up on May 12, 2025; the low of that day stands at 24,380 levels, and is likely to act as a significant support for now. As long as the Nifty manages to sustain above these levels, there could be a hope for the positive bias to prevail.
ALSO READ |
Stocks of Mukesh Ambani-owned companies dip up to 58% from 2024 high In case, both the support levels are violated the Nifty may extend the fall towards the 200-DMA, which stands at 24,080 levels.
Meanwhile, on the upside, the Nifty 50 index was seen facing consistent resistance around the higher-end of the Bollinger Bands around 25,200 levels. Going ahead, further gains for the Nifty can be anticipated only in case of break and sustained trade above 25,200 levels, with interim resistance likely around 25,050 levels.
 "NSE Nifty sinks below 24,500; is the market bullish set-up under threat?")


