Home / Markets / News / These 2 smallcap stocks see Golden Crossover on charts; can rally up to 21%
These 2 smallcap stocks see Golden Crossover on charts; can rally up to 21%
City Union Bank, Sumitomo Chemical stock outlook: Golden Crossover is a bullish technical indicator in the market; here are the key support and resistance levels to track on these 2 smallcaps.
City Union Bank, Sumitomo Chemical see Golden Crossover on charts. (Representative Image)
Shares of City Union Bank and Sumitomo Chemical India - smallcaps - have witnessed a Golden Crossover on the daily charts on Thursday, May 22. Technically, the term 'Golden Crossover' means that the short-term moving average - the 50-Day Moving Average (50-DMA) of the particular stock has now crossed-over the 200-DMA on the higher side. In general, a 'Golden Crossover' implies a bullish (positive) bias for the particular stock as the short-term moving average which crosses-over, tends to provide support at higher levels. CATCH LATEST STOCK MARKET LATEST UPDATES TODAY LIVE Here's a detailed technical analysis on these 2 smallcap stocks basis today's 'Golden Crossover'.
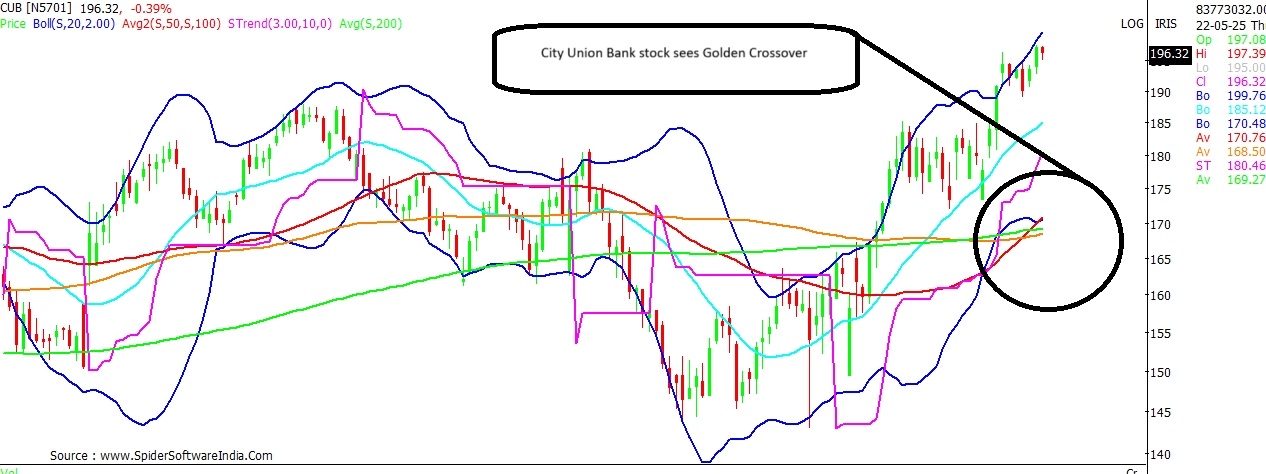
City Union Bank (CUB)
Current Price: ₹196 Upside Potential: 21% Support: ₹193.50; ₹189; ₹180 Resistance: ₹199; ₹207; ₹211; ₹227 City Union Bank stock has been making higher-highs and higher lows on the daily scale for the last two months. The stock is expected to trade on a buoyant note as long as it holds above ₹193.50 levels. Below which, support for the stock can be anticipated around ₹189 and ₹180 levels. CLICK HERE FOR THE CHART On the upside, the stock can potentially challenge its record high, which stands at ₹237. Technical chart shows presence of interim resistance around ₹199, ₹207, ₹211 and ₹227 levels. ALSO READ | How to trade Muthoot Finance stock as it tests 200-DMA support? Find out
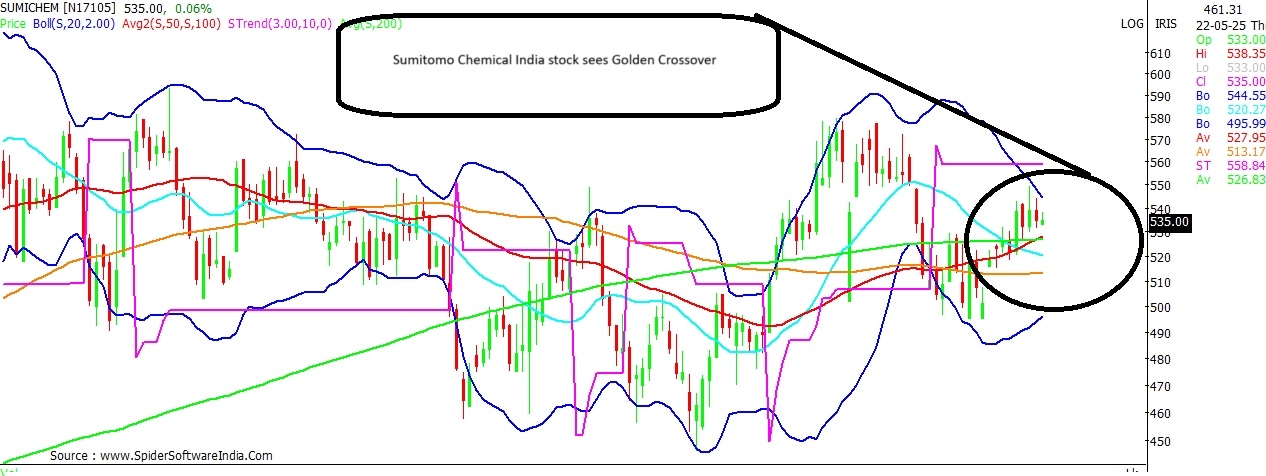
Sumitomo Chemical India
Current Price: ₹533 Upside Potential: 16.3% Support: ₹527; ₹514; ₹500; ₹476 Resistance: ₹559; ₹570 Sumitomo Chemical stock has been consolidating above its 200-DMA, which stands around ₹527 levels, in recent trading sessions. Below which, technical chart shows presence of support around ₹514 and ₹500 levels. The overall bias is likely to remain positive as long as the stock holds above ₹476. CLICK HERE FOR THE CHARTALSO READ | What should investors do with IndusInd Bank shares? Analysts weigh in On the upside, the stock faces interim resistance around ₹559. Break and sustained trade above the same can potentially trigger a rally towards ₹620 levels, with intermediate resistance around ₹570 levels.
 "These 2 smallcap stocks see Golden Crossover on charts; can rally up to 21%")