The case tally in India is now past the 150,000 mark. And, worryingly, 83,004 of those cases are active. The country’s death toll currently stands at 4,337.
Here are some statistics mapping the outbreak:
1. India took just eight days to add 50,000 cases to its tally
India recently crossed the 150,000 mark in total cases. Its pace of increase in cases is much faster now. In a sign of increase in pace at which cases are getting added, the third lot of 50,000 cases came in just eight days, compared with the 98 days India had taken to reach its first 50,000 cases, and 12 days to reach the second. The increased rate of addition could be attributed to the fact that net daily additions have been more 5,000 on each of the past eight days.
2. Growth in Covid-19 deaths in the US has slowed down
After the US reported its first Covid-19 death on March 1, 2020, it took 46 days for the death toll to reach 25,000. The next lot of 25,000 came much faster, in just 10 days. The rate has slowed considerably since, with the third block of 25,000 deaths being recorded in 13 days, and the fourth in 20.
3. These four Indian districts account for over half the deaths in their respective states
In India, four districts – Ahmedabad, Chennai, Kolkata, and Mumbai – account for more than 50 per cent of total deaths in their respective states. Ahmedabad, with a death count of 745, alone has an 81 per cent of all deaths in Gujarat. Of all fatalities reported in Tamil Nadu, 73 per cent are just in Chennai. Mumbai, which has the highest death toll among all Indian districts, accounts for 59 per cent of Maharashtra’s death toll.
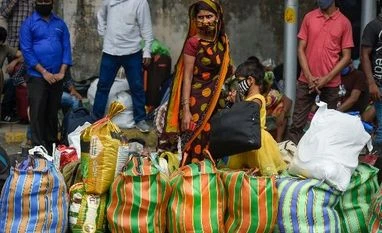 "lockdown, coronavirus, Migrant workers")