Equity markets in India were seen trading with a negative bias on Monday amid fresh global worries, a likely slowdown in the US economy, Russia-Ukraine conflict and new coronavirus scare from China. The BSE Sensex was down 1 per cent or 730 points in intra-day trades at 75,580 levels, while the
NSE Nifty 50 index too declined 1 per cent at 22,570 levels.
The selling has been broad-based in today's trading session, with the mid-cap, small-cap and most sectoral indices also declining over 1 per cent each. Amid this, the Nifty Financial Services (Fin Nifty) recently saw the formation of a 'Death Cross' on the daily chart.
The Fin Nifty has seen the formation of the 'Death Cross' on the daily scale for the first-time since September 07, 2022 - i.e. more than 29 months. Technically, the term 'Death Cross' means that the 50-DMA (Daily Moving Average) of the particular index or stock has now fallen below the 200-DMA. This development has bearish implications on the particular index or stock as the short-term moving average tends to act as a near-term hurdle.
Post the 'Golden Cross' i.e. the 50-DMA crossing over the 200-DMA in September 2022, the Fin Nifty index witnessed a strong bullish trend, and rallied up to 39 per cent from then levels of 18,140 to a high of 25,202 in September 2024.
ALSO READ: Sensex, Nifty technically oversold, await relief rally; track weekly levels Can a 'Death Cross' trigger a similar sharper movement on the downside? Here's what the chart suggests for the Fin Nifty and 5 key stocks from the index.
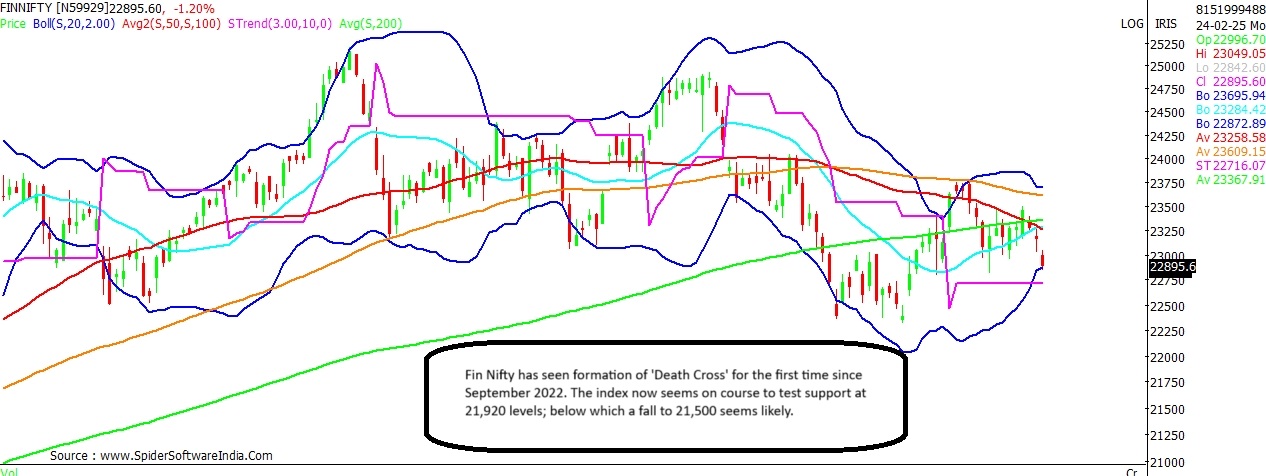
Nifty Financial Services (Fin Nifty) Current Level: 22,950
Downside Risk: 6.3%
Support: 22,700; 21,920
Resistance: 23,250; 23,300; 23,600
At present,
Fin Nifty has shed 9 per cent from its peak, and is seen trading below the key moving averages on the daily scale. The index is also trading below its 20- and 50-WMA (Weekly Moving Averages), and seems on course to test the 20-MMA (Monthly Moving Average) support at 21,920 levels; below which a test of 21,500 seems likely.
The overall bias is likely to remain negative as long as the index remains below 23,600 levels. Interim resistance for Fin Nifty stands at 23,250 - 23,300 zone. Near support for the index exists at 22,700 levels.
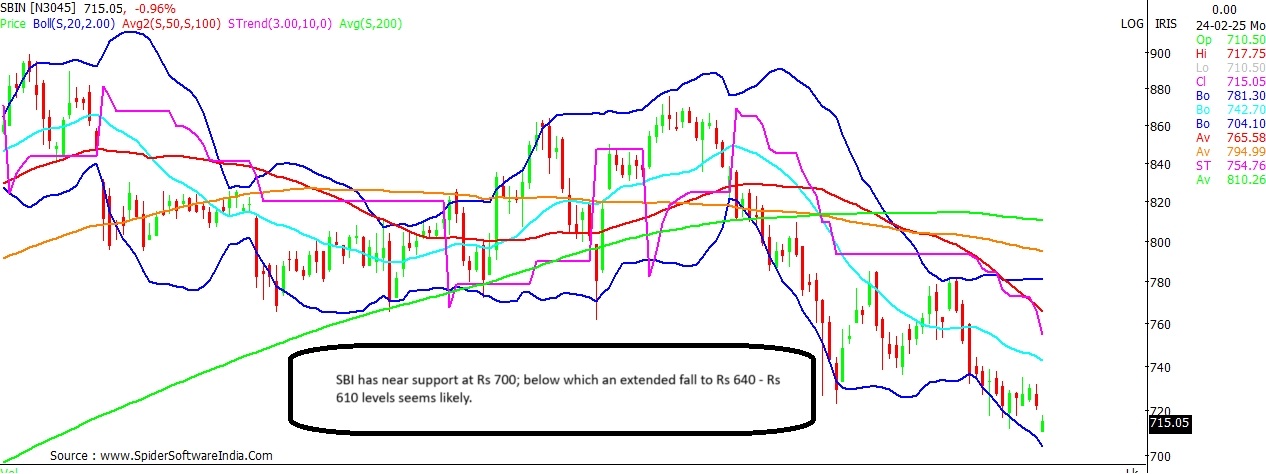
CLICK HERE FOR THE CHART SBI Current Price: Rs 716
Downside Risk: 14.8%
Support: Rs 700; Rs 640
Resistance: Rs 726; Rs 740; Rs 750
SBI stock has tumbled over 22 per cent from its peak of Rs 912 in the last eight months. The stock witnessed formation of 'Death Cross' in mid-January 2025, and since then has declined around 9.5 per cent. At present, the stock is seen trading below its 20-MMA (Monthly Moving Average), which stands at Rs 726, for the first time since December 2020.
ALSO READ: Breakdown stock: SBI can tank 16% if this level is broken. Details here Chart shows presence of near support for SBI at Rs 700; break and sustained trade below the same shall open the doors for an extended fall towards Rs 640 - Rs 610 levels. In case of a pullback, the stock is expected to face resistance around Rs 740 and Rs 750 levels.
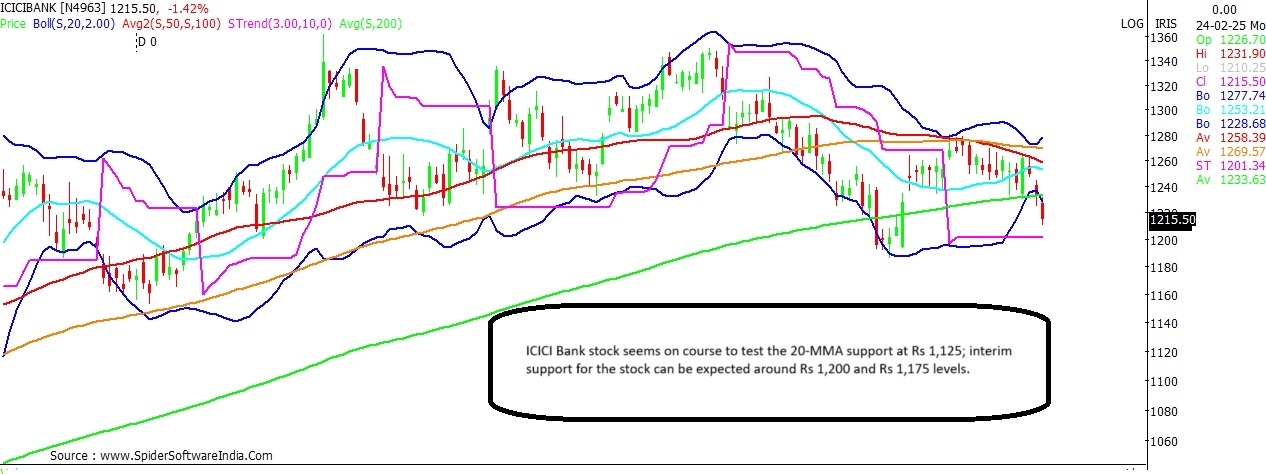
CLICK HERE FOR THE CHART ICICI Bank Current Price: Rs 1,215
Downside Risk: 7.4%
Support: Rs 1,200; Rs 1,175
Resistance: Rs 1,235; Rs 1,255; Rs 1,267
ICICI Bank share was technically one of the stronger stocks in the banking space. The stock, however, has now tanked over 10 per cent from its December high owing to the overall weakness in the broader market. The stock now seems on course to test its key 20-MMA support, which the stock has held since November 2020. The 20-MMA support stands at Rs 1,125 - this implies a downside risk of 7.4 per cent.
Interim support for the stock exists at Rs 1,200 and Rs 1,175. Near resistance for the stock is seen at Rs 1,235 and Rs 1,255. The near-term bias is likely to remain tepid as long as the stock trades below Rs 1,267.
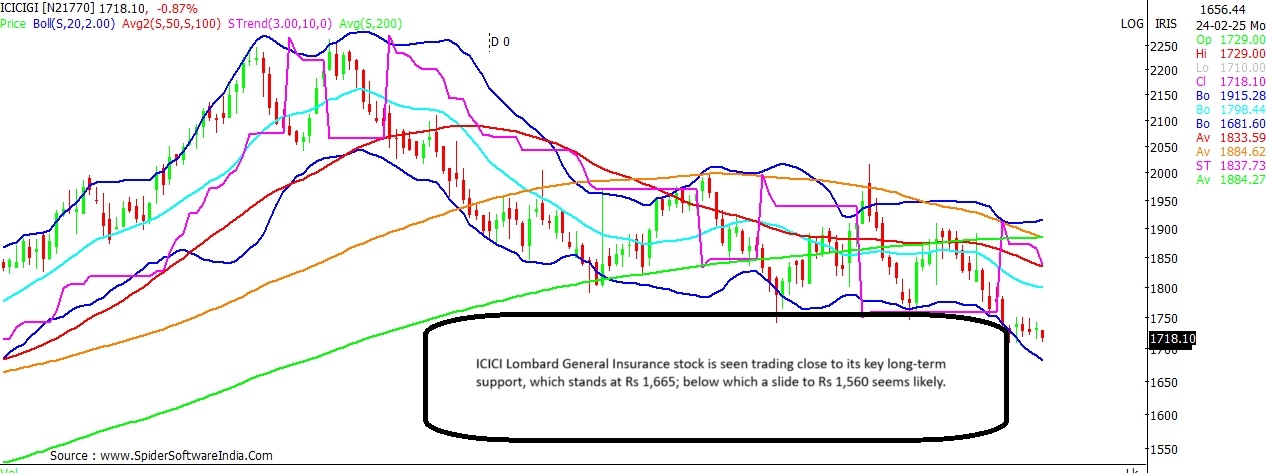
CLICK HERE FOR THE CHART ICICI Lombard General Insurance Current Price: Rs 1,723
Downside Risk: 9.5%
Support: Rs 1,715; Rs 1,665
Resistance: Rs 1,850
ICICI Lombard General Insurance stock is seen trading close to its key long-term support, which stands at Rs 1,665. That apart, the stock has near support at Rs 1,715. In case, the long-term support is violated, the stock can extend the fall to Rs 1,560 levels. Overall bias for the stock is likely to remain tepid as long as it trades below Rs 1,850.
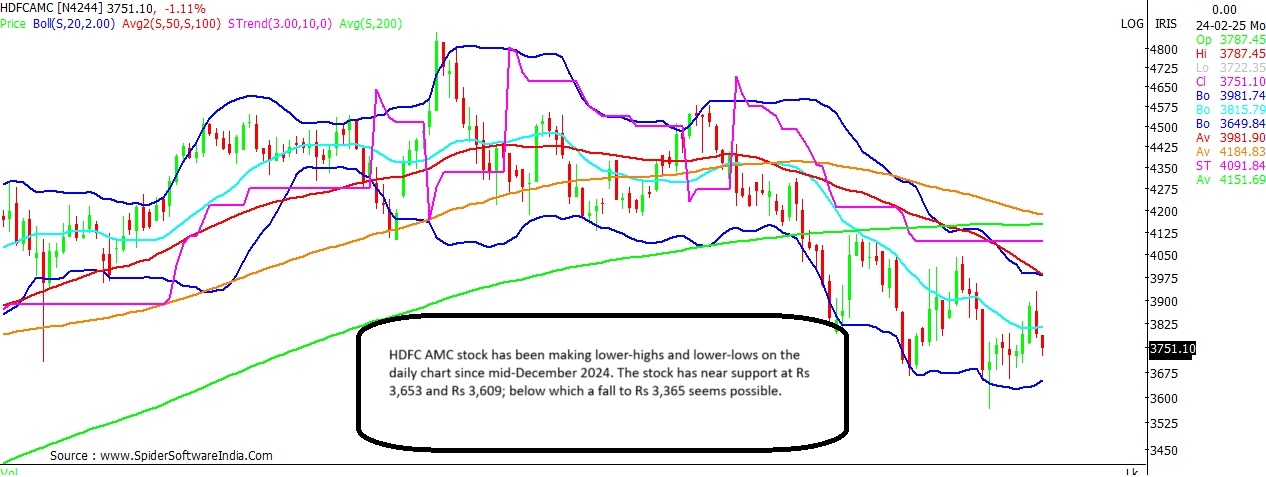
CLICK HERE FOR THE CHART ALSO READ: Can smallcap stocks crash trigger a capitulation phase? What analysts say HDFC AMC Current Price: Rs 3,768
Downside Risk: 10.7%
Support: Rs 3,653; Rs 3,609
Resistance: Rs 3,980
HDFC AMC stock has been making lower-highs and lower-lows on the daily chart since mid-December 2024. At present, the stock is seen testing support at its 20-MMA (Monthly Moving Average), which stands at Rs 3,609. Break and sustained trade below the same can trigger a fall towards Rs 3,365. Interim support can be anticipated around Rs 3,653 levels. Upside for the stock seems capped around Rs 3,980.
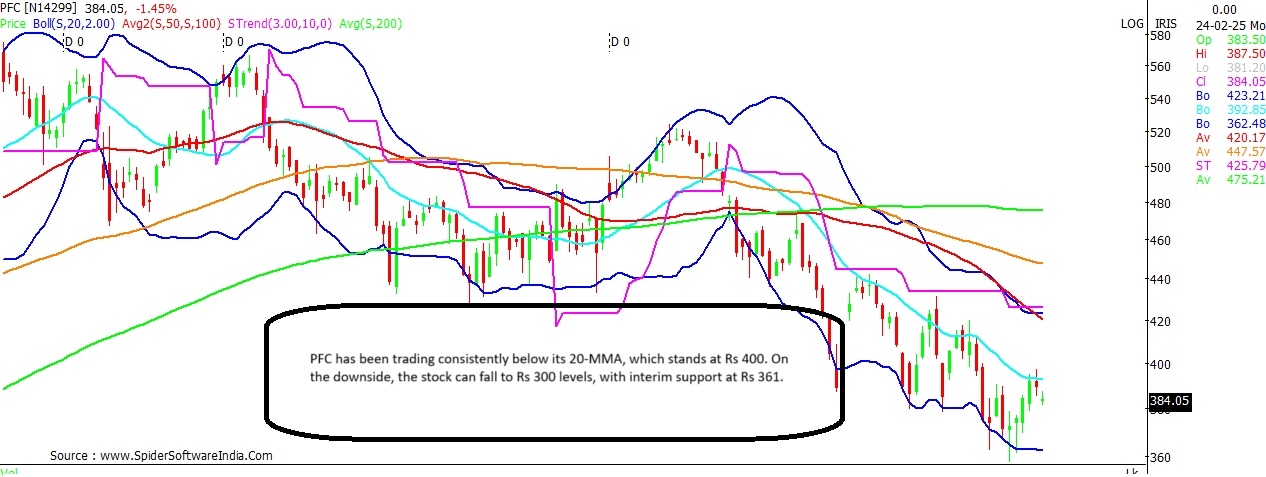
CLICK HERE FOR THE CHART Power Finance Corporation (PFC) Current Price: Rs 386
Downside Risk: 14.5%
Support: Rs 361
Resistance: Rs 426
PFC stock has been trading consistently below its 20-MMA, which stands at Rs 400, in recent days. The stock last traded below this key moving average in November 2022. On the downside, the stock can potentially slide to Rs 330; with interim support expected around the 100-WMA at Rs 361. The bias for the stock is expected to remain bearish as long as the stock trades below Rs 426.
CLICK HERE FOR THE CHART  "Death Cross Alert: 5 stocks on the verge of crashing; check details")
