Technical outlook on private banking stocks: Shares of private banking stocks were seen trading with notable losses in intra-day trades on Tuesday, dragged by IndusInd Bank which nose-dived over 20 per cent after the bank stated that an internal review of its derivative portfolio revealed discrepancies, for which the bank estimates Rs 1,577 crore or approximately 2.35 per cent hit on its net worth as of December 2024.
Yesterday, too, the stock was the top loser in the private banking space, down nearly 4 per cent after the Reserve Bank of India approved a shorter-term (1 year) extension to the bank's CEO Sumant Kathpalia as against 3-year sought by the bank. As per reports, prominent brokerage firms have revised downwards the target price for IndusInd Bank amid this news flow, as analysts’ fear the focus over the next one year could be on a succession plan.
So far this morning, the Bank Nifty was down 0.8 per cent. Apart from
IndusInd Bank, Bandhan Bank shed 5 per cent. RBL Bank, Federal Bank, IDFC First Bank and Axis Bank were the other major losers.
Against this background here's a technical outlook on IndusInd Bank and the top private sector banks for the likely trend ahead.
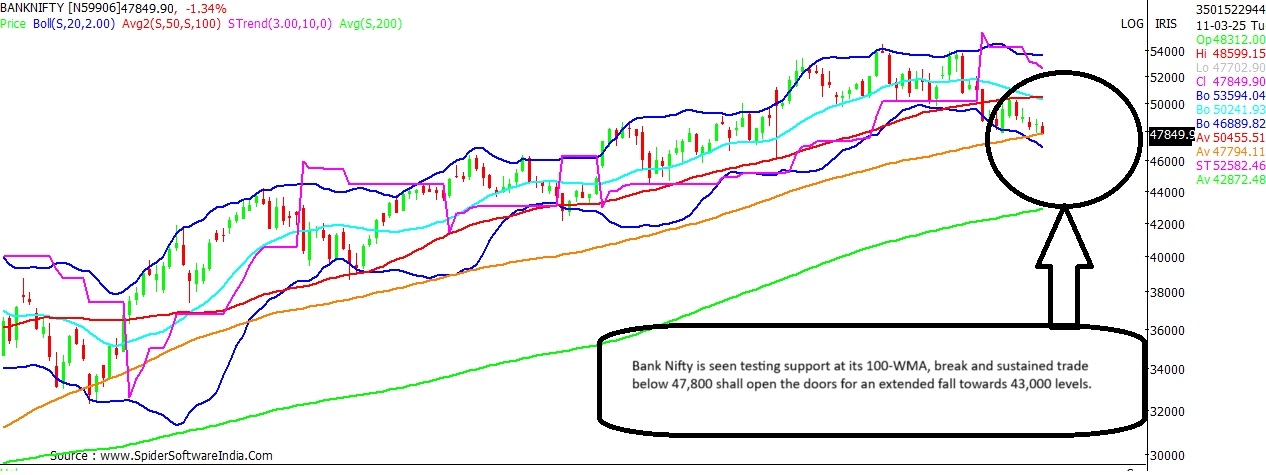
Bank Nifty Current Level: 47,800
Downside Risk: 10%
Support: Rs 47,800; 47,000; 46,500; 45,000
Resistance: Rs 48,500
The
Bank Nifty is seen testing support at the lower-end of the Bollinger Bands at 47,800 levels; this also coincides with the 100-WMA (Weekly Moving Average) support - a key moving average the index has broadly respected since November 2020. However, on the monthly scale the index is seen quoting below its 20-MMA (Monthly Moving Average), which stands at 48,500 levels.
Thus, the near-term bias is expected to remain tepid as long as the index remains below 48,500; above which the key hurdle stands at 50,200 levels.
CLICK HERE FOR THE CHART On the other hand, break and sustained trade below 47,800 shall open the doors for a likely slide towards 43,000-mark. Interim support can be anticipated around 47,000, 46,500 and 45,000 levels.
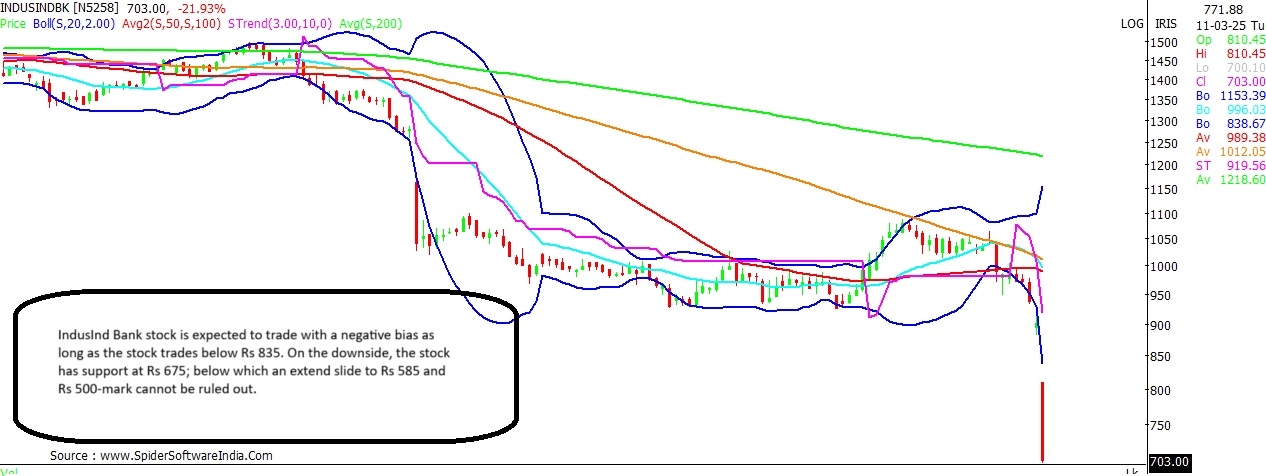
ALSO READ: Stocks to Buy: 24% upside likely in these 5 shares with market-cap below Rs 20 cr IndusInd Bank Current Price: Rs 720
Downside Risk: 30.5%
Support: Rs 783; Rs 675
Resistance: Rs 835
IndusInd Bank was one of the worst performing stocks of the calendar year 2024, as it ended the year with a loss of 39.3 per cent as against a rally of 8.8 per cent in the NSE benchmark
Nifty 50 index, and a 5.5 per cent gain on the Bank Nifty. So far this year, the stock has now shed 25 per cent and remains one of the key underperformer in the Nifty 50 and the private banking space.
ALSO READ: IndusInd Bank hits lowest level since Nov 2020; why are the shares falling? The near-term bias for IndusInd Bank is expected to remain bearish as long as the stock trades below Rs 835. Amid today's fall the stock broke below its 200-MMA, which stands at Rs 820, for the first time since September 2020.
CLICK HERE FOR THE CHART The yearly Fibonacci chart shows that sustained trade below Rs 783 shall drag the stock towards Rs 675. Below which, an extended fall to Rs 585 and Rs 500 cannot be ruled out - this implies a downside risk of 30.5 per cent from present levels.
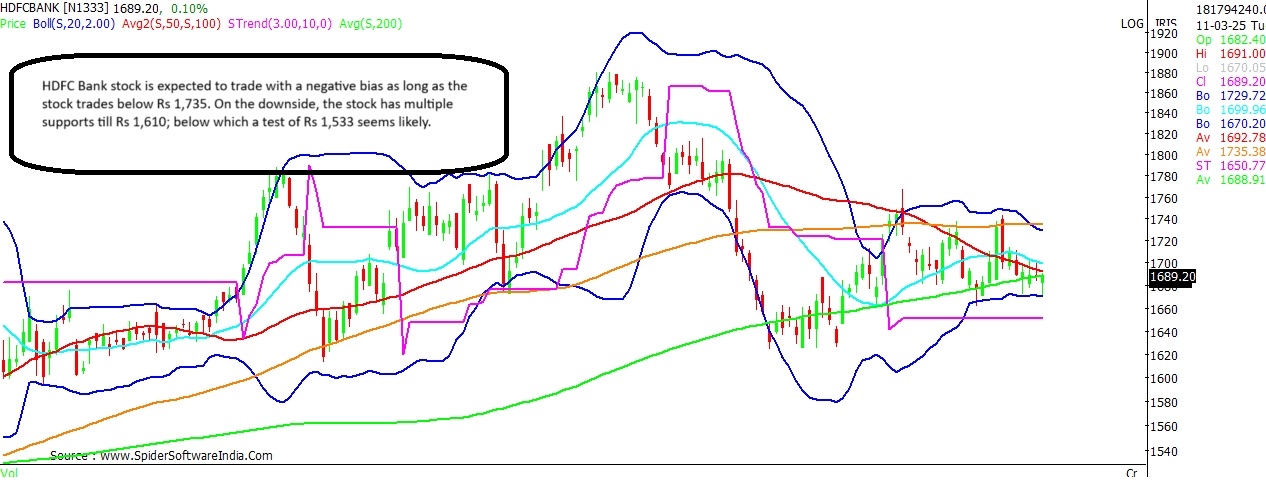
HDFC Bank Current Price: Rs 1,685
Downside Risk: 9%
Support: Rs 1,670; Rs 1,650; Rs 1,610
Resistance: Rs 1,735
HDFC Bank has been consolidating around its 200-DMA for the last few trading sessions. The daily chart shows presence of multiple supports at Rs 1,670 and Rs 1,650 levels. Break of the same can trigger a fall towards 1,533, with interim support likely at Rs 1,610. For the sentiment to turn favourable the stock needs to break and sustain above its 100-DMA (Daily Moving Average) at Rs 1,735.
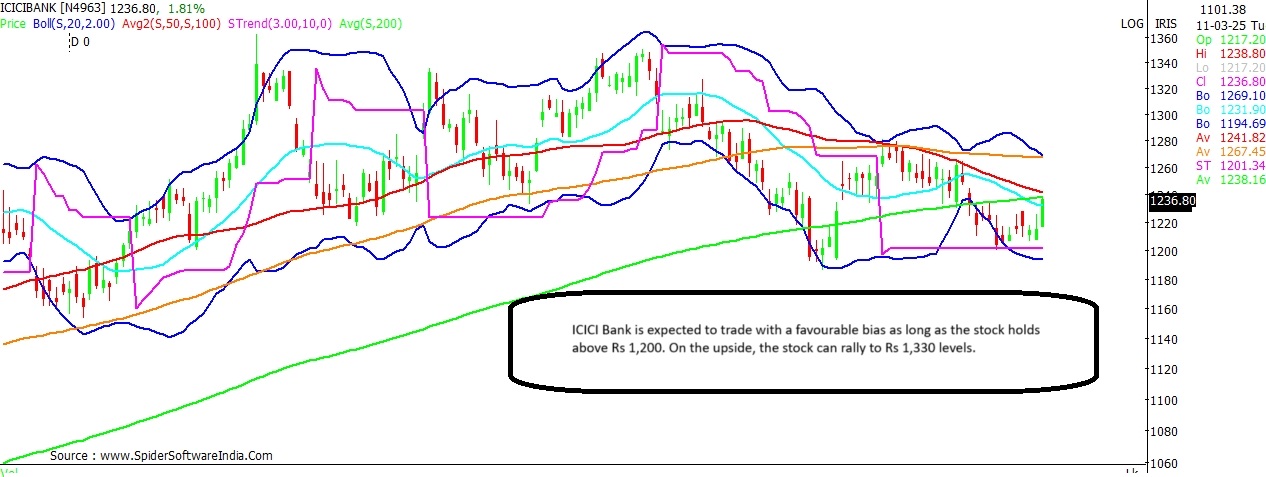
CLICK HERE FOR THE CHART ALSO READ: Power stocks: Buy in Summer, Sell in Winter; chart hints up to 27% upside ICICI Bank Current Price: Rs 1,234
Upside Potential: 7.8%
Support: Rs 1,200
Resistance: Rs 1,238; Rs 1,265
ICICI Bank is seen testing resistance at its 200-DMA at Rs 1,238. Meanwhile, the key momentum oscillators on the daily chart are showing positive crossovers; hence the stock may be able to clear this hurdle. The near-term bias is expected to remain favourable as long as the stock holds above Rs 1,200. On the upside, the stock can potentially surge to Rs 1,330 levels, with interim resistance likely at Rs 1,265.
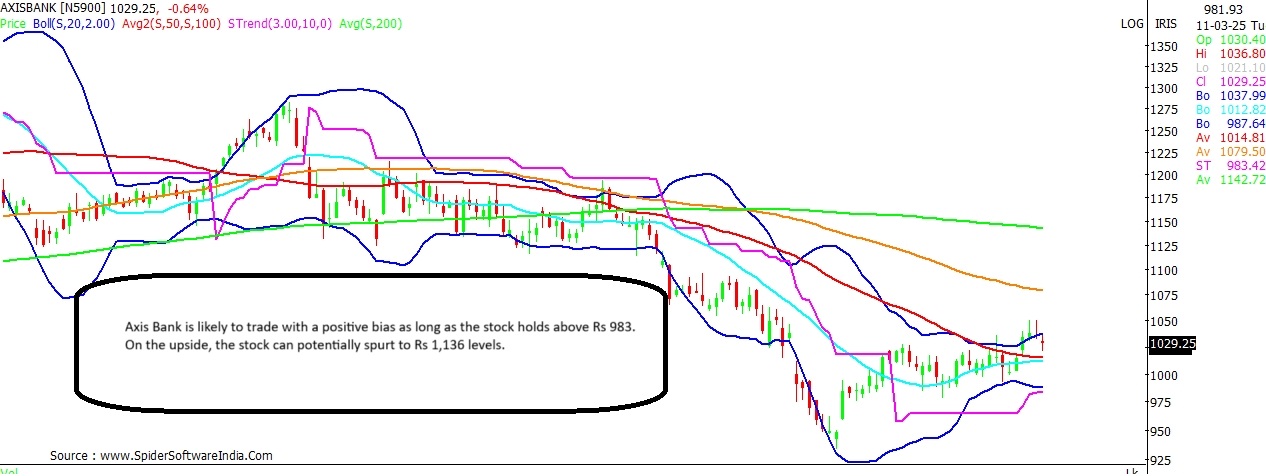
CLICK HERE FOR THE CHART Axis Bank Current Price: Rs 1,026
Upside Potential: 10.7%
Support: Rs 983
Resistance: Rs 1,073
Axis Bank stock had recovered partly from its January low of Rs 933, and was seen consolidating above its 20- and 50-DMA in recent days. The near-term bias for the stock is expected to remain cautiously positive as long as the stock holds above Rs 1,012; below which the key support stands at Rs 983.
CLICK HERE FOR THE CHART The long-term chart shows that the stock is trading in an oversold zone, and needs to clear the 100-WMA hurdle at Rs 1,073 for a meaningful pullback. On the upside, the stock can spurt to Rs 1,136 levels.
 "IndusInd Bank stock outlook: Chart shows 30% fall, can slip to Rs 500-mark")
