Shares of brokerages and market infrastructure institutions (MIIs) were seen trading on a mixed note on Monday following a sharp sell-off in the previous trading sessions on account of Sebi's crackdown on Jane Street.
Shares of Nuvama Wealth, the domestic trading partner of Jane Street, were up 2 per cent. 5Paisa Capital also gained 2 per cent in early deals on July 07. Among other brokerages, Motilal Oswal, IIFL Capital Services and Angel One traded with marginal losses.
Last Friday, these stocks logged losses up to 11% after the Securities and Exchange Board of India (Sebi) debarred the US proprietary firm - Jane Street - a prominent player in the futures and options (F&O) segment - from Indian stock markets. Analysts believe this move could impact F&O volumes.
READ MORE CATCH STOCK MARKET LATEST UPDATES TODAY LIVE Here's a trading strategy in Jane Street affected shares based on the existing technical chart patterns.
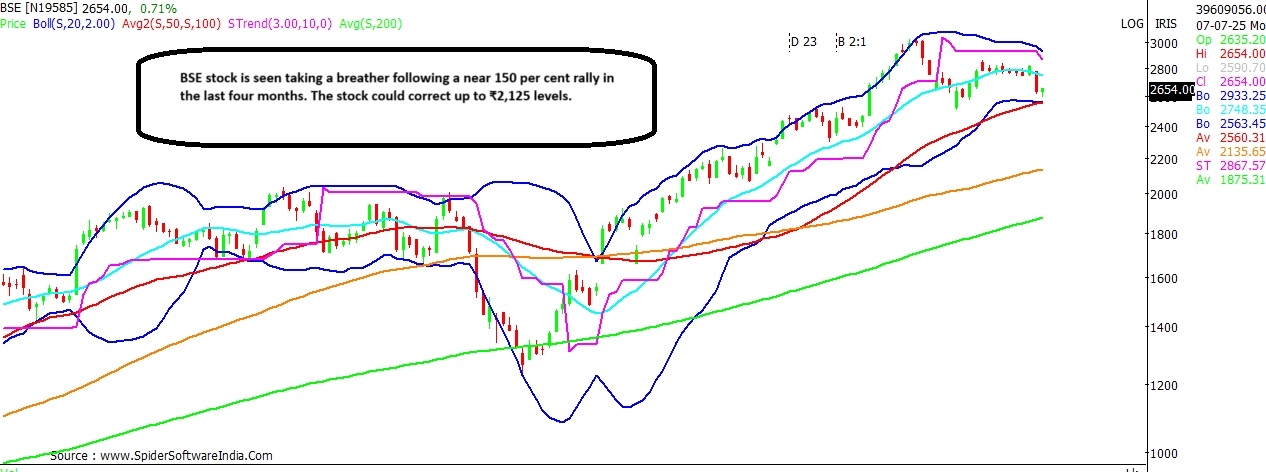
BSE
Current Price: ₹2,647
Likely Target: ₹2,125
Downside Risk: 19.7%
Support: ₹2,540; ₹2,340
Resistance: ₹2,748; ₹2,868
BSE stock is witnessing some profit-taking following a four-month rally, wherein the stock near-about zoomed 150 per cent from a low of ₹1,222 in the month of March to a record high of ₹3,030 in June 2025. The stock has now shed roughly 12 per cent from its peak.
CLICK HERE FOR THE CHART Technically, a standard retracement of around 38.2 per cent of the preceding rally indicates a likely downside target of ₹2,340 for the BSE stock, whereas 50 per cent retracement could see the stock slide to ₹2,125 levels. Near support for the stock can be anticipated around ₹2,540 levels. Technical chart suggests that the near-term bias at the counter is likely to remain tepid as long as the stock trades below ₹2,868 levels, with interim resistance seen at ₹2,748 levels.
ALSO READ | CDSL stock eyes 'cup and handle' pattern breakout; can it hit ₹3,000-mark? Nuvama Wealth Management
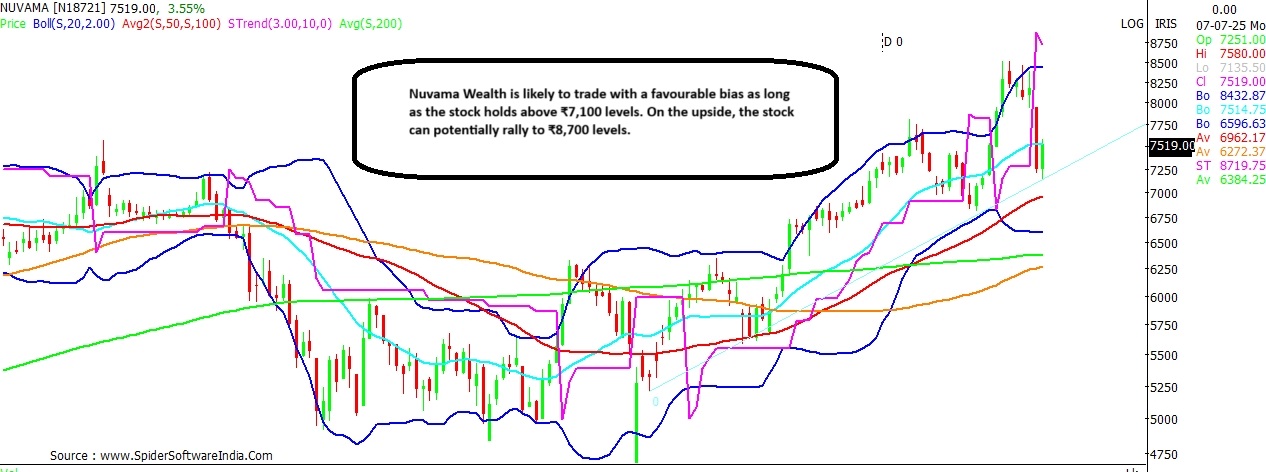
Current Price: ₹7,525
Likely Target: ₹8,700
Upside Potential: 15.6%
Support: ₹7,100
Resistance: ₹7,940; ₹8,300
Nuvama Wealth stock has been making higher-highs and higher lows on the daily chart since early April 2025. The stock at present is seen testing support at the trend line adjoining the recent lows, which indicate support at ₹7,100 level. As long as this support is protected the stock may attempt a pullback towards ₹8,700 levels in the near-term. Interim resistance can be anticipated around ₹7,940 and ₹8,300 levels.
CLICK HERE FOR THE CHART Angel One
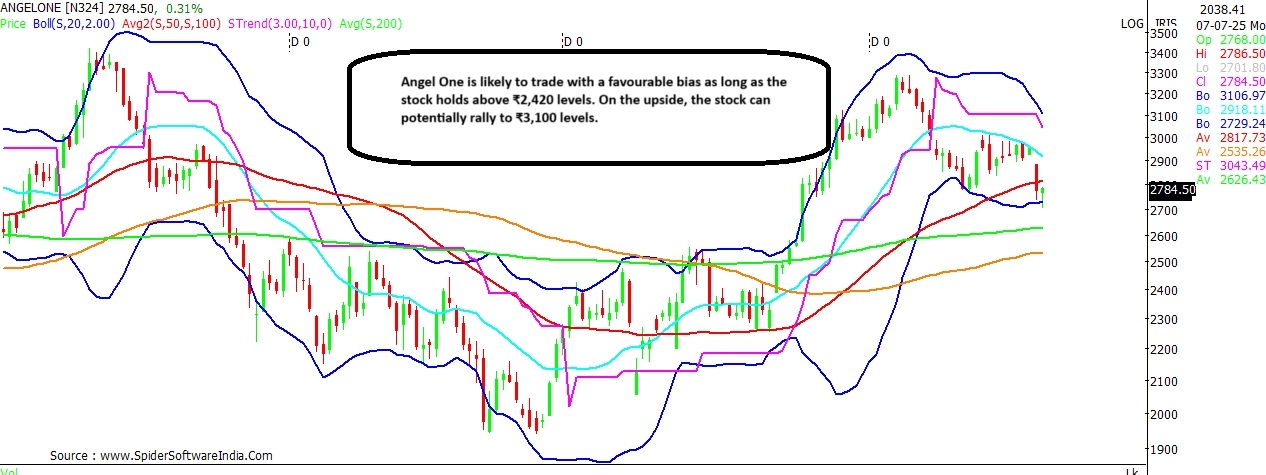
Current Price: ₹2,770
Likely Target: ₹3,300
Upside Potential: 19.1%
Support: ₹2,667; ₹2,550; ₹2,420
Resistance: ₹2,920; ₹3,030; ₹3,100
Angel One stock is likely to trade with a favourable bias as long as the stock holds above ₹2,420 levels. Interim support for the stock can be anticipated around ₹2,667 and ₹2,550 levels. On the upside, the stock can potentially bounce back to ₹3,300 levels, with interim resistance likely around ₹2,920, ₹3,030 and ₹3,100 levels.
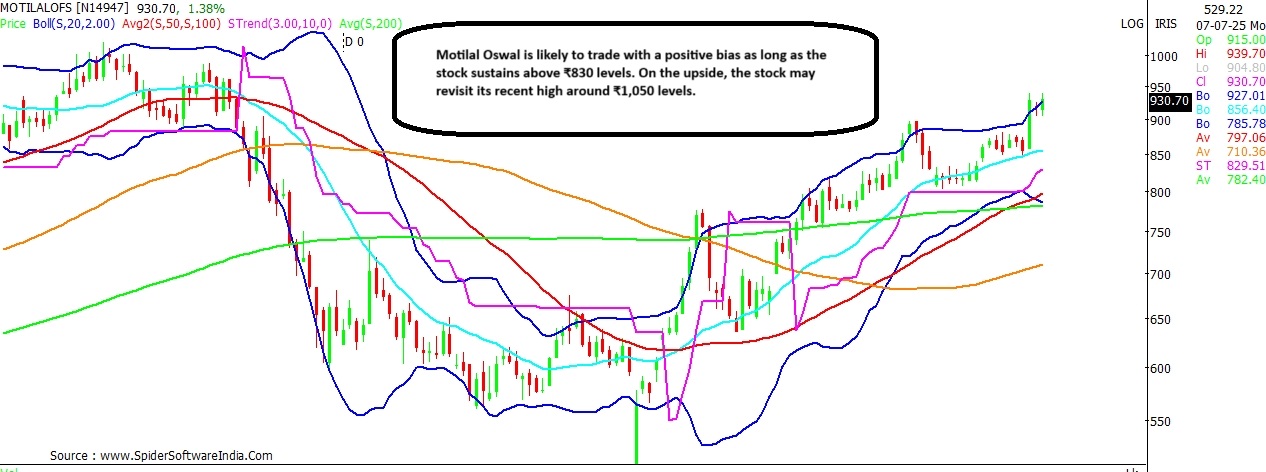
CLICK HERE FOR THE CHART Motilal Oswal Financial Services
Current Price: ₹925
Likely Target: ₹1,050
Upside Potential: 13.5%
Support: ₹855; ₹830
Resistance: ₹940; ₹1,020
Motilal Oswal stock looks strong on the charts. The short-term bias at the counter is likely to remain bullish as long as the stock holds above ₹855 and ₹830 support levels. On the upside, the stock may aim to re-visit its summit around ₹1,050 levels. Interim resistance can be seen around ₹940 and ₹1,020 levels.
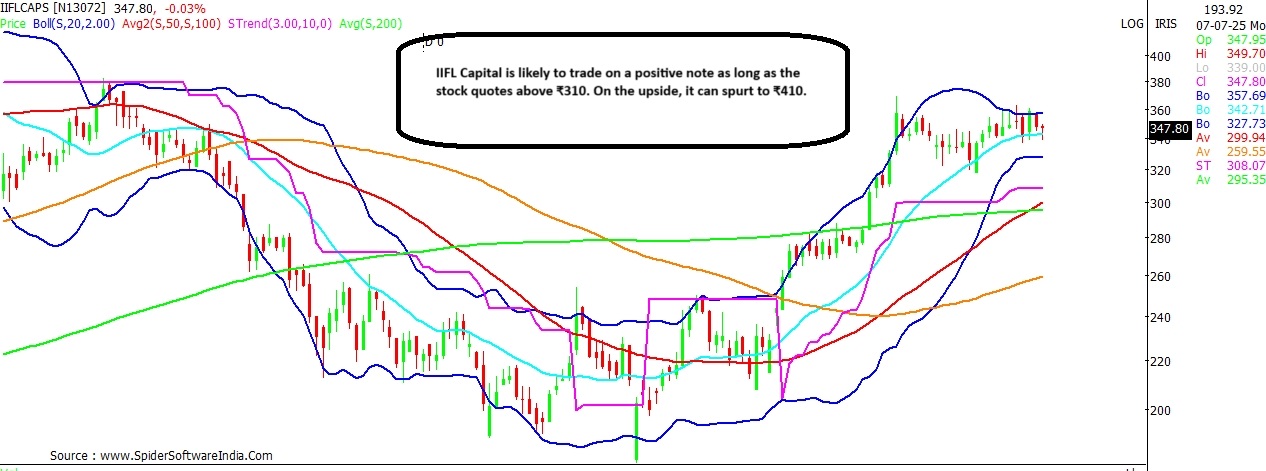
CLICK HERE FOR THE CHART ALSO READ | Lodha stock tests 'Head & Shoulders' neckline support; check downside risk IIFL Capital Services
Current Price: ₹347
Likely Target: ₹410
Upside Potential: 18.2%
Support: ₹343; ₹310
Resistance: ₹370; ₹385
IIFL Capital Services shares have been consistently finding support around its 20-Day Moving Average (20-DMA) for the last two months. The 20-DMA support now stands at ₹343, below which the key support stands near ₹310 levels. The stock is likely to trade with a positive bias as long as these support levels are held. On the upside, the stock may attempt a spurt towards ₹410 levels. Intermediate resistance can be seen around ₹370 and ₹385 levels.
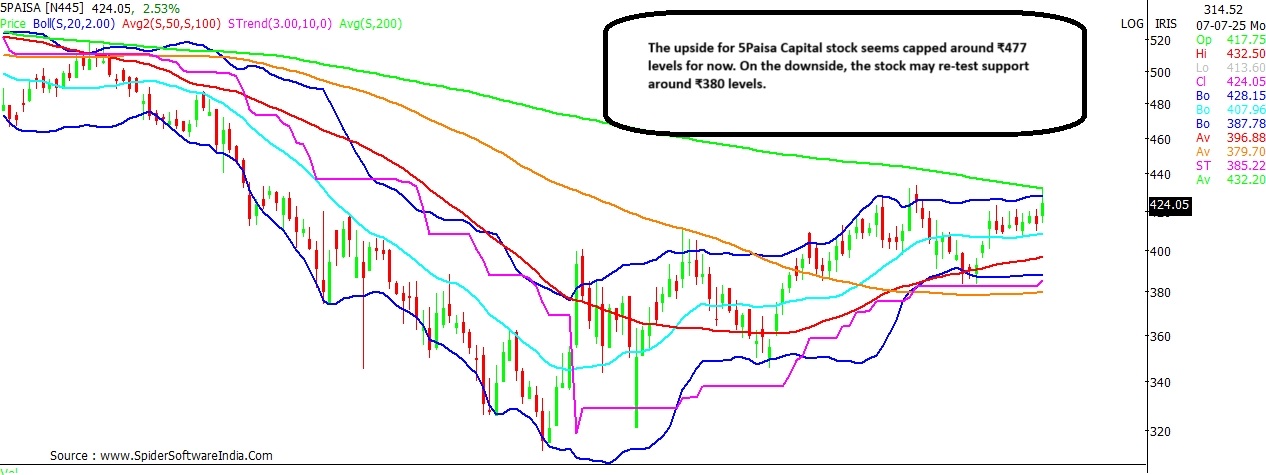
CLICK HERE FOR THE CHART 5Paisa Capital
Current Price: ₹425
Upside Potential: 12.2%
Downside Risk: 10.6%
Support: ₹408; ₹397
Resistance: ₹432; ₹450; ₹477
5Paisa Capital has been trading below its long-term 200-DMA since October 21, 2024. Today, the stock is seen testing resistance around its 200-DMA, which stands at ₹432. The medium-term chart shows presence of overhead resistance around ₹450 and ₹477, levels. Thus, the upside for the stock seems limited for now. On the other hand, failure to clear the 200-DMA could see the stock drift back towards the 100-DMA support around ₹380 levels. Interim support for the stock exists at ₹408 and ₹397 levels.
CLICK HERE FOR THE CHART  "Jane Street crackdown: BSE stock faces 20% downside risk, charts suggest")


