The
NSE Nifty IT index fell 1.6 per cent, and was the top loser on the NSE in intra-day deals on Tuesday after the US market crashed up to 4 per cent on fears of a potential recession risk.
The US President in an interview said, the US economy was going through "a period of transition", while not ruling out recession in the US economy. That apart, existing economic indicators too suggest an impending recession with inflation likely to remain higher owing to a possible adverse impact of a global trade-war.
"President Trump's flip-flop tariff policy and the possibility of US recession by the year end have started impacting the US stock market. We will have to wait and watch how the situation develops", said Dr. V K Vijayakumar, Chief Investment Strategist at Geojit Financial Services.
Reports also suggest that the present US debt-to-GDP ratio stood at 122 per cent, its highest-ever level. The US debt has doubled in the last 15 years, and stands at $36.2 trillion, of which one-fourth of is due for refinancing in the current calendar year.
According to a report on US Wealth Management, a major concern for investors is not just about the growing level of US debt, but how the higher interest rate environment affects debt repayment.
Back home, the IT sector tends to be directly impacted by developments in the US. As such,
Infosys was the major loser among the IT pack, down 3 per cent today. Wipro, Tech Mahindra, CoForge, L&T Technology Services, MphasiS and LTI MindTree were the other major losers - down over 1 per cent each.
Against this background, here's a technical outlook on Nifty IT and key technology shares.
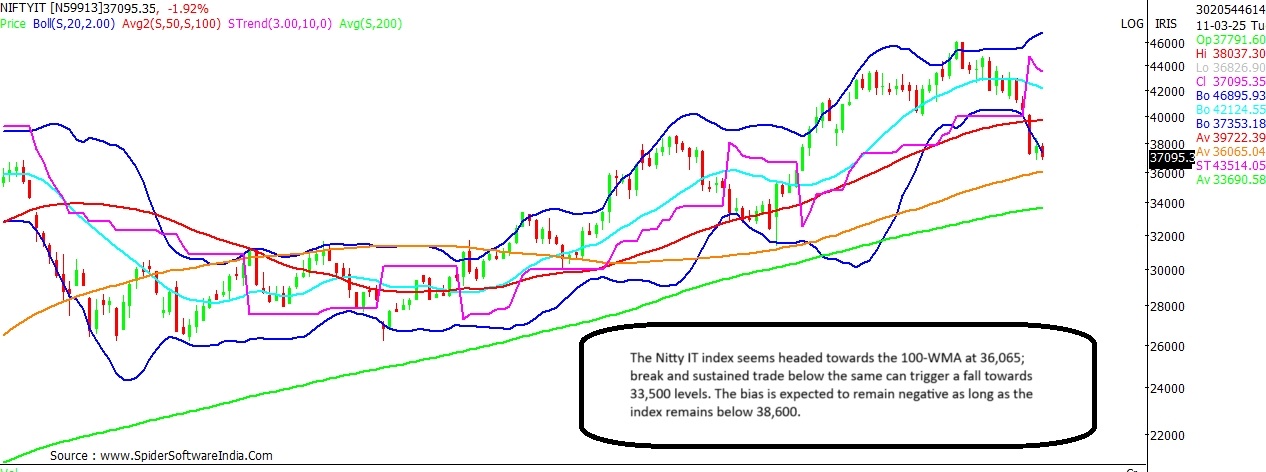
Nifty IT Current Level: 37,105
Downside Risk: 9.7%
Support: 36,065
Resistance: 38,600
The Nifty IT index seems headed towards its 100-WMA (Weekly Moving Average), which stands at 36,065 - a key average the index has held since September 2023. Given the weak chart set-up, the index could break below the same and extend the fall towards its next major support at 33,500 levels - thus implying a downside risk of 9.7 per cent from present levels. For now, the near-term bias is expected to remain negative as long as the IT index remains below 38,600 levels.
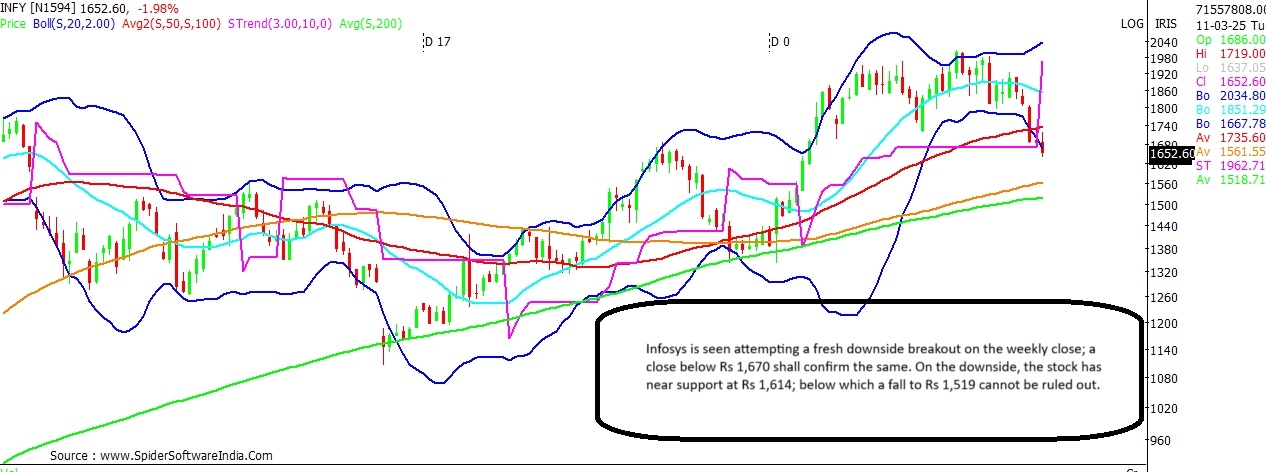
CLICK HERE FOR THE CHART Infosys Current Price: Rs 1,653
Downside Risk: 8.1%
Support: Rs 1,614
Resistance: Rs 1,735
Infosys stock is trading in a fairly oversold zone; further with today's 3 per cent fall, the stock is now seen attempting a negative breakout on the weekly scale. A close below Rs 1,670 this Friday, shall confirm a downside breakout on the stock on the weekly time-frame.
CLICK HERE FOR THE CHART Technical chart shows that Infosys seems on course to test support at its 100-WMA at Rs 1,563; below which a dip towards the 200-WMA at Rs 1,519 cannot be ruled out. Support for the stock exists at Rs 1,614. In case of a pullback, the stock is expected to face resistance at Rs 1,735.
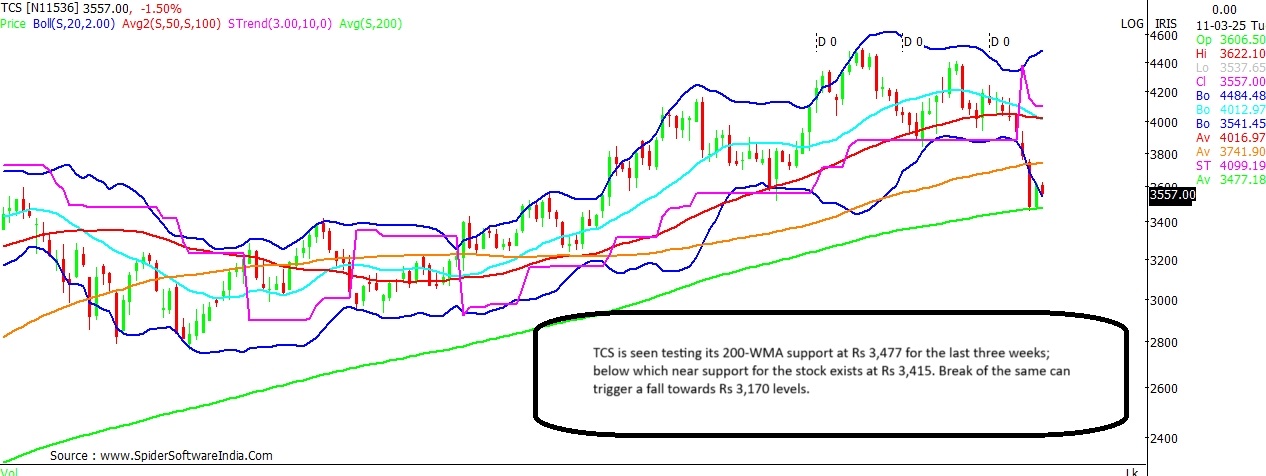
ALSO READ: IndusInd Bank stock outlook: Chart shows 30% fall, can slip to Rs 500-mark TCS Current Price: Rs 3,560
Downside Risk: 11%
Support: Rs 3,477; 3,415
Resistance: Rs 3,711
TCS stock has been testing support at its 200-WMA for the last three weeks - a key moving average the stock has held since May 2017. The 200-WMA stands at Rs 3,477; below which key support for the stock exists at Rs 3,415. As long as these support levels are protected, TCS may witness some consolidation. Break and sustained trade below the support levels can trigger a fall to Rs 3,170. On the upside, the stock needs to break above Rs 3,711 for the sentiment to revive at the counter.
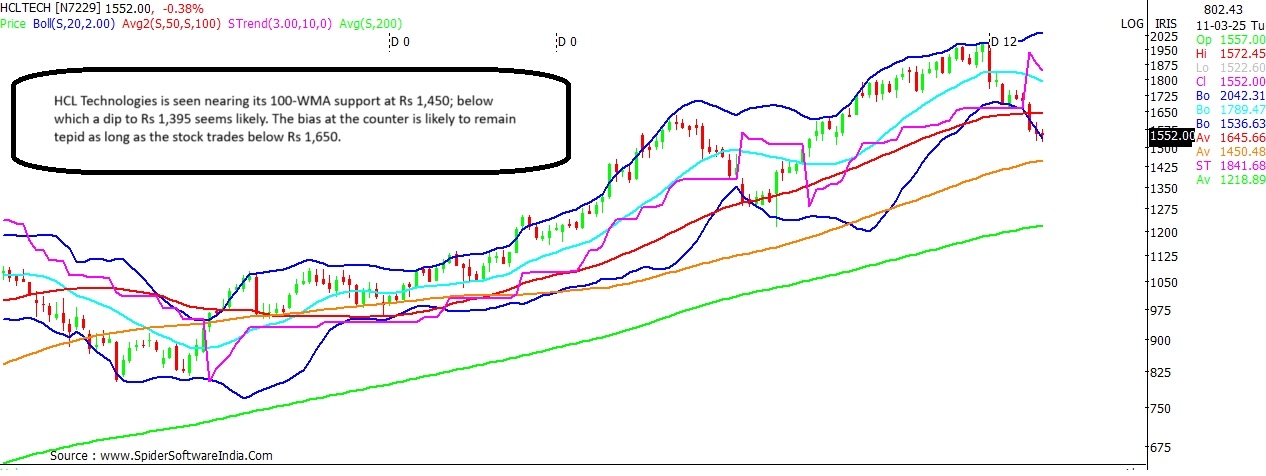
CLICK HERE FOR THE CHART HCL Technologies Current Price: Rs 1,552
Downside Risk: 10.1%
Support: Rs 1,515; Rs 1,450
Resistance: Rs 1,650
HCL Technologies stock is seen nearing its 100-WMA support, which stands at Rs 1,450. Interim support for the stock exists at Rs 1,515; while a dip to Rs 1,395 cannot be ruled out. The near-term bias is expected to remain tepid as long as the stock trades below Rs 1,650.
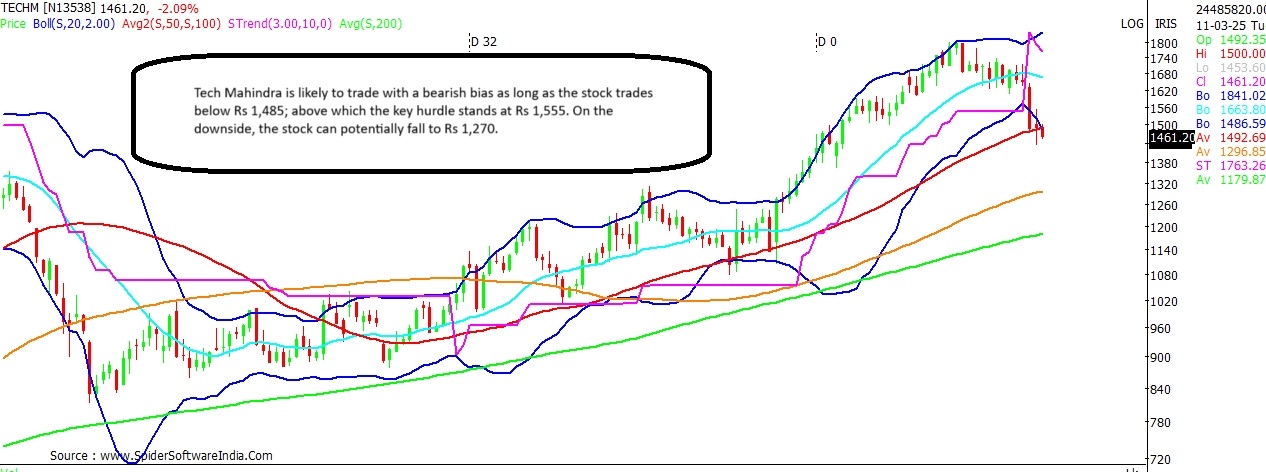
CLICK HERE FOR THE CHART Tech Mahindra Current Price: Rs 1,461
Downside Risk: 13.1%
Support: Rs 1,350
Resistance: Rs 1,485; Rs 1,555
The near-term bias for
Tech Mahindra is expected to remain negative as long as the stock trades below Rs 1,485. On the downside, the stock seems headed towards Rs 1,350 - wherein stands the 20-MMA (Monthly Moving Average); below which a dip to Rs 1,270 cannot be ruled out. For the sentiment to turn favourable, the stock will need to overcome the 200-DMA hurdle at Rs 1,555 levels.
CLICK HERE FOR THE CHART  "US Recession? Nifty IT can tank another 10%; key levels on tech stocks here")
