Is Nifty IT index the best bet when frontline indices correct?
Wipro's technical chart indicates pressure between Rs 343-Rs 334 levels. The stock in recent past has retraced from the support of 200-day EMA located around Rs 290- Rs 300 levels.
 "Nifty IT chart")
premium
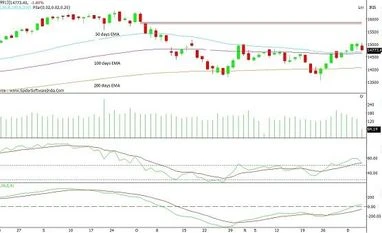
Nifty IT chart
NIFTY IT INDEX: The index has rebounded sharply from 200-day Exponential Moving Average (EMA) and is currently halted at 50-day EMA and 100-day EMA located at 14,690 and 14,630, respectively. The technical indicator Relative Strength Index (RSI) is hovering around 60-odd levels while Moving Average Convergence Divergence (MACD) is trending above zero line.