The NSE Nifty Smallcap 250 index was seen testing resistance around its 200-Day Moving Average (200-DMA) for the second time in as many weeks. The
Nifty Smallcap 250 index touched an intra-day high of 16,694 on Monday as against its 200-DMA, placed at 16,720 levels.
The index had retraced partly from the day's high, but still held above the 16,600 levels. Technical chart shows the presence of multiple hurdles around the 16,700 - 17,000 range for the Nifty Smallcap index. Breakout and sustained trade above this resistance zone can trigger a potential rally towards 18,200 levels, hint charts.
Against this background, here are 5 smallcap stocks - Anand Rathi, Clean Science, Suven Life Sciences, Pfizer and Jindal Saw - that seem to be favourably placed on the charts for now.
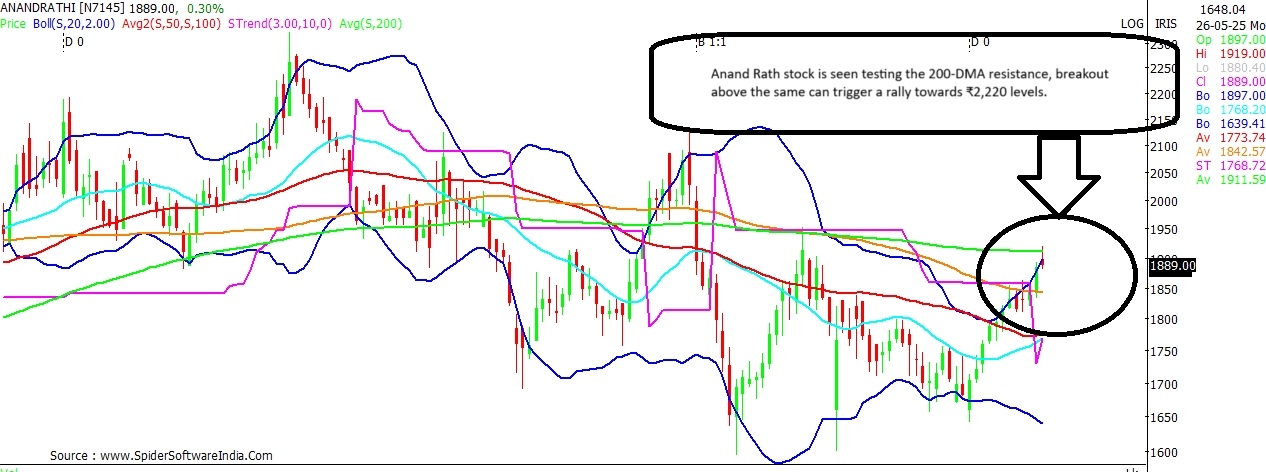
Anand Rathi
Current Price: ₹1,891
Upside Potential: 17.4%
Support: ₹1,843; ₹1,773
Resistance: ₹1,913; ₹2,015
Anand Rathi stock is seen testing the 200-DMA resistance on the daily scale. The stock, however, has witnessed a breakout on the super trend line indicator. Thus, the stock is expected to trade with a positive bias as long as it holds above ₹1,773, with near support at ₹1,843.
CLICK HERE FOR THE CHART On the upside, above the 200-DMA hurdle which stands at ₹1,913, the stock can potentially rally towards ₹2,220, with interim resistance seen around ₹2,015 levels.
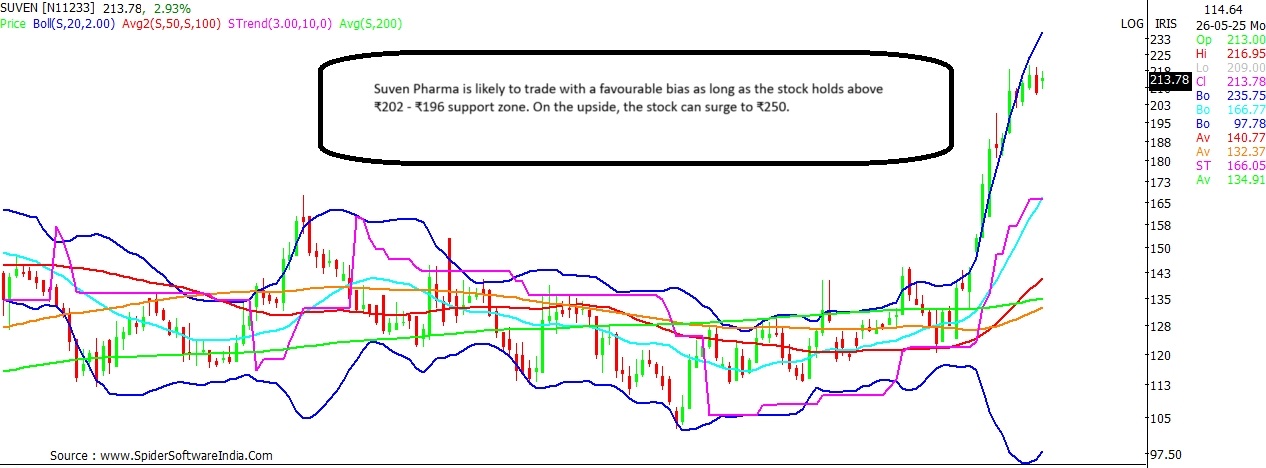
ALSO READ | Sensex, Nifty favourably placed; these levels may shape market this week Suven Life Sciences
Current Price: ₹214
Upside Potential: 16.8%
Support: ₹202; ₹196
Resistance: ₹217; ₹237
Suven Life stock chart indicates that the near-term bias for the stock is expected to remain upbeat as long as the stock trades above ₹202, below which key support for the stock exists at ₹196 levels. At present, the stock is trading close to its crucial resistance, which stands at ₹216.60. Break and sustained trade above the same shall open the doors for a rally towards ₹250 levels, with interim resistance likely around ₹237.
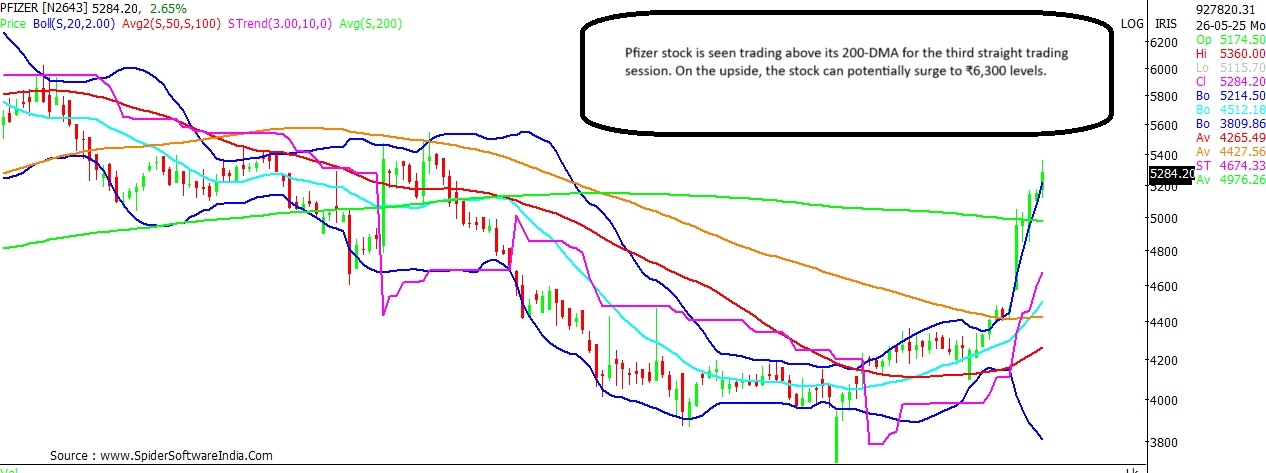
CLICK HERE FOR THE CHART Pfizer
Current Price: ₹5,290
Upside Potential: 19.1%
Support: ₹5,115; ₹4,975
Resistance: ₹5,960
Pfizer stock is seen trading above its 200-DMA for the third straight trading session, after a gap of more than four months. The short-term bias for the stock is expected to remain favourable as long as the stock holds above ₹4,975 levels; near support for the stock exists at ₹5,115. On the upside, the stock can potentially surge to ₹6,300 levels, with interim resistance likely around ₹5,960.
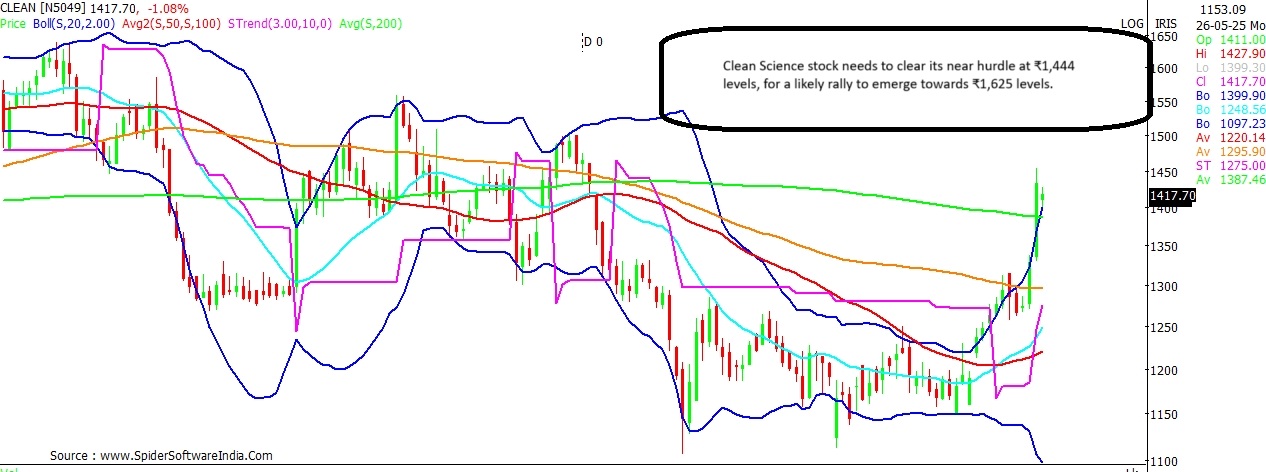
CLICK HERE FOR THE CHART ALSO READ | Breakout stocks! Max Financial, Hitachi, Solar Inds may rally up to 23% Clean Science and Technology
Current Price: ₹1,425
Upside Potential: 14.1%
Support: ₹1,387; ₹1,370; ₹1,338
Resistance: ₹1,444; ₹1,500
Clean Science stock is seen quoting above its 200-DMA, which stands at ₹1,387, for the second straight trading session. Below which, the stock has reasonable support around ₹1,370 and ₹1,338 levels. On the upside, the stock needs to break and trade consistently above 1,444 levels, for a likely rally towards ₹1,625. Interim resistance can be anticipated around ₹1,500 levels.
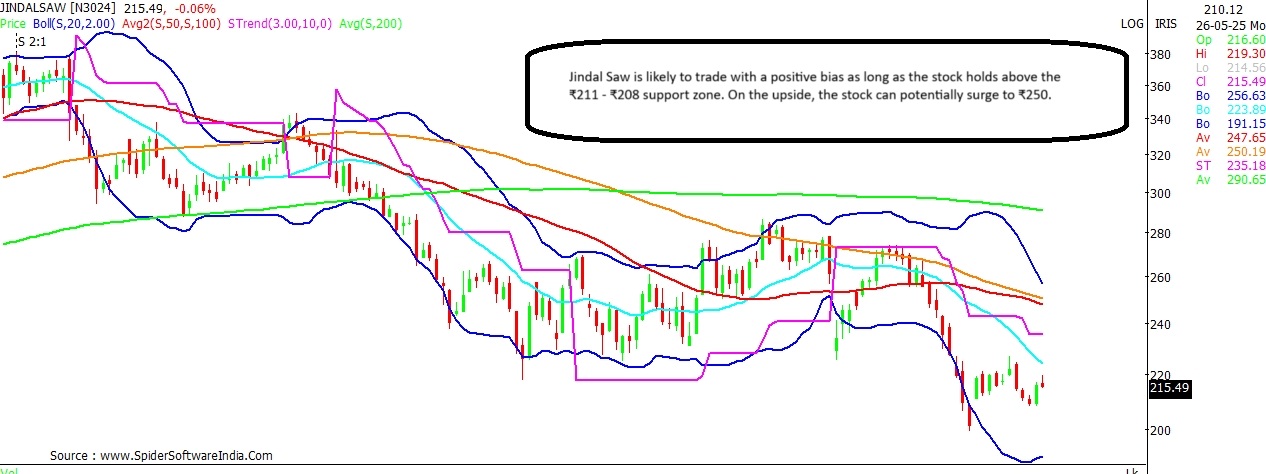
CLICK HERE FOR THE CHART Jindal Saw
Current Price: ₹215
Upside Potential: 16.3%
Support: ₹211; ₹208
Resistance: ₹2224; ₹235; ₹246
Key momentum oscillators for
Jindal Saw stock are showing positive crossover on the daily charts; thus implying a likely positive bias in the near-term. The stock needs to break above its 20-DMA resistance, which stands at ₹224 for a likely rally to emerge towards ₹250 levels. Intermediate resistance can be seen around ₹235 and 246 levels. In case of a dip, the stock is likely to seek support around ₹211 and ₹208 levels.
CLICK HERE FOR THE CHART  "5 stocks to bet on as Nifty Smallcap reaches 200-DMA; check full list here")


