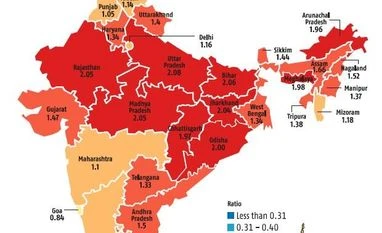
Chart 1 maps the epidemiological transition ratio — defined as the ratio of DALYs caused by communicable, maternal, neonatal, and nutritional diseases (CMNNDs) to those caused by non-communicable diseases (NCDs) and injuries — between 1990 and 2016. A ratio greater than one indicates a higher burden of CMNNDs than NCDs and injuries. As the two India maps show, this ratio has come down across the board suggesting a shift in the country’s disease patterns. In other words, while mortality due to CMNNDs has declined substantially, and Indians are living longer, yet the overall disease burden due to NCDs and injuries has been rising. Chart 2 shows the aggregate data in this regard.
Chart 3 shows the change in the top 5 diseases, in terms of DALYs, in 1990 and 2016. This chart, too, shows a massive shift. For instance, measles, which was ranked 5 in 1990, was ranked 59th in 2016. Chart 4 shows the top 5 risk factors facing Indians. While air pollution has moved up, metabolic risks, e.g. high blood pressure, have rapidly jumped up the ladder.
1: EPIDEMIOLOGICAL TRANSITION RATIOS OF THE STATES OF INDIA IN 1990 AND 2016
*COPD is chronic obstructive pulmonary disease; ** WaSH is unsafe water, sanitation, and handwashing Note: The percent figure in brackets is DALYs attributable from that disease /risk factor out of the total DALYs
StatsGuru is a weekly feature. Every Monday, Business Standard guides you through the numbers you need to know to make sense of the headlines. Source: India: Health of Nation’s States, a report by the Indian Council of Medical Research, Public Health Foundation of India, and the Indian Institute of Health Metrics and Evaluation; Compiled by BS Research Bureau
 "graph")