StatsGuru: Tracking the trends in commodity prices
 "Click on graphic")
<I>Click on graphic</I>
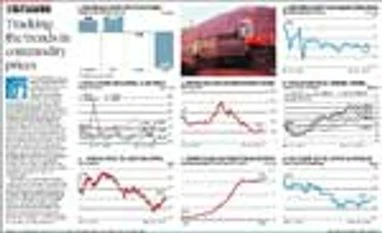
The commodities universe, which has suffered from a lengthy decline in values, was rocked over the past month by a sharp revival in some prices - particularly iron ore, the price of which rose sharply over the past month after declining substantially for years, as Table 1 shows. This was driven by optimism about increased demand from China, but the numbers complicate that analysis.
As Table 2 shows, there is no broad-based revival in Chinese manufacturing demand if electricity consumption growth is to be taken as an indicator. Chinese exports are also slumping, as Table 3 shows - India's are as well, as are commodity exporter Brazil's, though India's peer countries like Malaysia are not doing so badly.
Overall, the Baltic Dry Index in Table 4, an indicator of world trade, does not necessarily indicate a resumption of high-demand conditions. Yet many metals have trended upwards in the year-to-date, as Table 5 shows.
Oil prices, too, have begun seeing a revival, as Table 6 shows; the prices have broken $40 a barrel for the first time in a while. But there is likely to be a cap on oil prices, driven by the possibility that growth in shale gas production might resume - as Table 7 shows, a steep increase in shale gas production has plateaued in the period oil has been cheap. It is also worth noting that coal, in Table 8, is cheaper - but the reduction in coal price, too, has plateaued.

Don't miss the most important news and views of the day. Get them on our Telegram channel
First Published: Mar 21 2016 | 12:05 AM IST