Benchmark equity indices are set to end the first-half of the calendar year 2025 on a firm note. The National Stock Exchange (NSE) benchmark, the
Nifty 50 index, has gained 8.4 per cent thus far this year, while its counterpart the
Bombay Stock Exchange (BSE) Sensex has advanced 7.6 per cent.
Sectorally, the Nifty Bank index has been the top performer, up 12.7 per cent in the last six months and now quoting at new life-time highs. Followed by, the Nifty Metal and Oil & Gas indices, which have surged more than 10 per cent each. Among others, the PSU Bank, Auto and Energy indices gained in the range of 4 - 7 per cent.
On the flip side, the Nifty IT index has been the worst performer, down 10.4 per cent as of June 27, 2025. The Nifty Pharma, Realty, Media and FMCG indices were down 3 - 6 per cent each.
ALSO READ | Mid, small-caps underperform large-caps in H1 as investors run for cover Meanwhile, the NSE Nifty 50 index is now just 2.5 per cent shy from its all-time high of 26,277. Can the index hit a new high in the second-half of 2025, and how much can it rally from here?
Here's what the technical charts suggest for the Nifty and key sectoral indices.
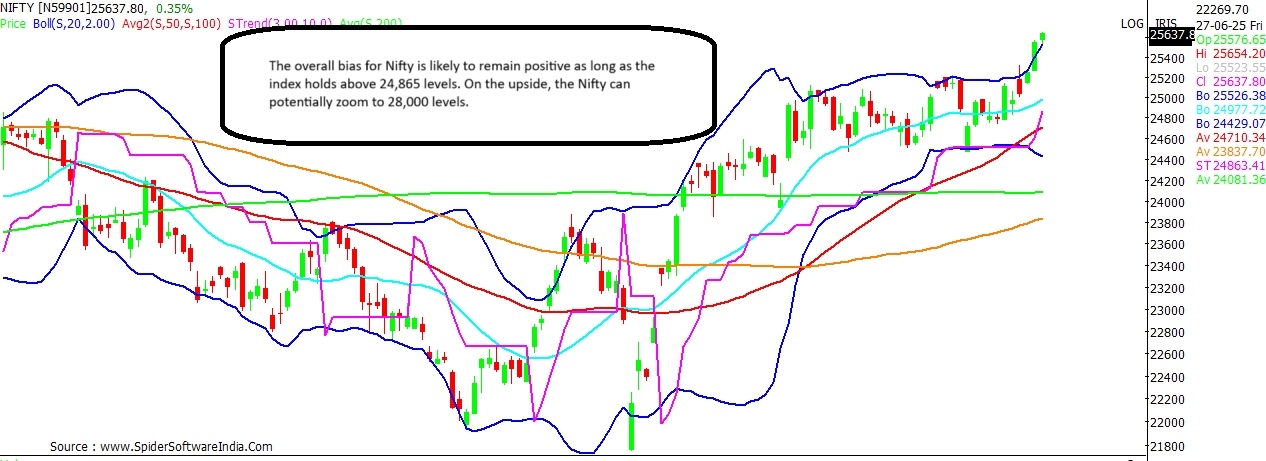
Nifty 50
Last close: 25,638
Upside Potential: 9.2%
Support: 25,530; 25,250; 25,125; 25,000; 24,865
Resistance: 25,900; 26,277; 26,550; 27,120; 27,580
At present levels, the
Nifty 50 index is seen quoting at the highs of the calendar year, up almost 18 per cent from the low of 21,744 hit on April 7, 2025. Technically, the Nifty seems favourably placed across time-frames.
CLICK HERE FOR THE CHART In the very near-term, the bias is likely to remain upbeat as long as the NSE benchmark index holds above 25,530 levels. The overall short-term bias for Nifty is likely to remain favourable as long as the index holds above 24,865 levels, with interim support seen at 25,250, 25,125 and 25,000-mark.
ALSO READ | 10 large-cap stocks to bet across sectors that may gain up to 32% in H2CY25 On the upside, the index seems headed towards its crucial resistance, which stands at 25,900 levels. Break and sustained trade above the same can trigger a rally towards potential new highs. The Nifty had registered a peak at 26,277 in September 2024.
In the coming months, the Nifty can potentially surge towards 28,000-mark, with intermediate resistance anticipated around 26,550, 27,120 and 27,580 levels.
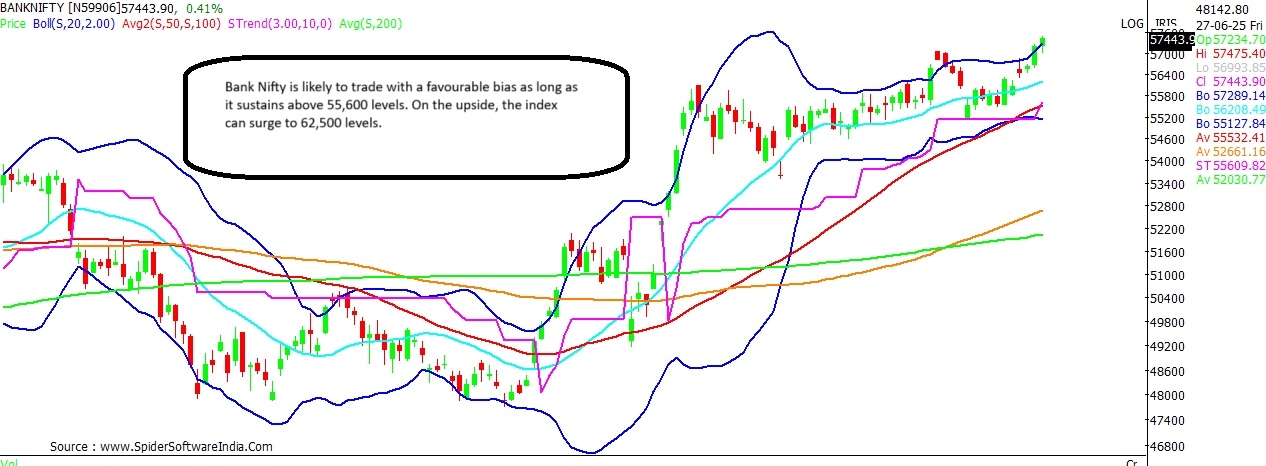
Nifty Bank (Bank Nifty)
Last close: 57,444
Upside Potential: 8.8%
Support: 57,000; 56,600; 56,200; 55,600
Resistance: 59,000; 59,400; 60,600; 61,600
The
Bank Nifty chart is showing an extended bullish momentum on the medium-term charts. The index can potentially spurt to 59,000 levels in the near-term. On the higher-end, Bank Nifty can potentially rally towards 62,500 levels. Intermediate resistance for the index can be anticipated around 59,400, 60,600 and 61,600 levels.
CLICK HERE FOR THE CHART The near-term bias is likely to remain positive as long as the banking index holds above 55,600 levels. Near support for the index exists at the 57,000-mark followed by 56,600 and 56,200 levels.
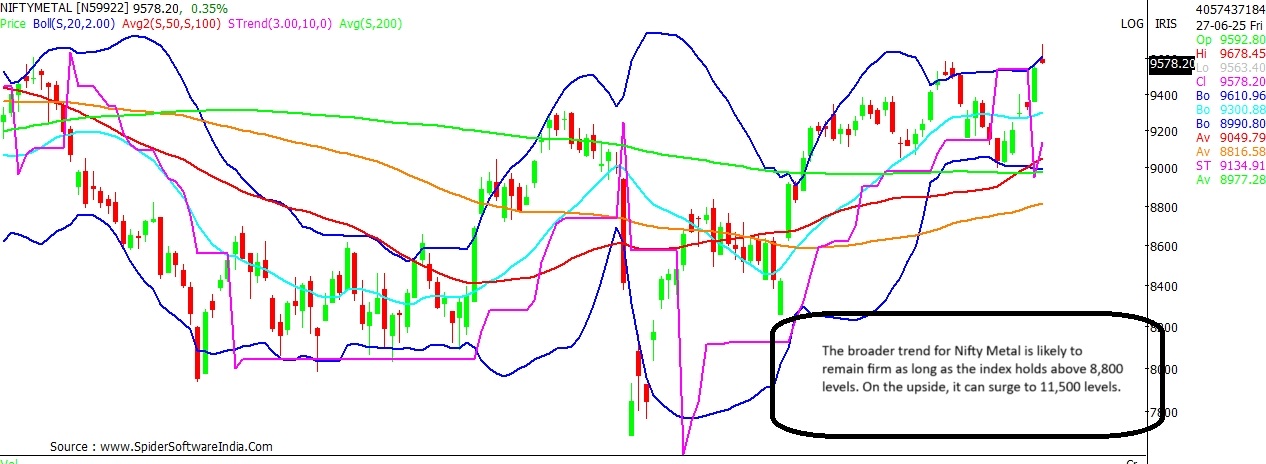
Nifty Metal
Last close: 9,578
Upside Potential: 20.1%
Support: 9,300; 9,135; 8,800
Resistance: 10,070; 10,360; 10,600; 10,830; 11,050
The
Nifty Metal index has witnessed a fresh breakout on the daily scale in recent days. The short-term bias is likely to remain favourable as long as the index holds above 9,135 levels, with near support seen at 9,300. The broader trend is likely to remain up as long as the index sustains above 8,800 levels.
CLICK HERE FOR THE CHART The weekly chart shows that the Nifty Metal index has also witnessed a breakout for the first time since November 8, 2024. As such, the index can now potentially rally towards its summit at 10,260 levels; beyond which the index can soar to 11,500 levels. The Metal index may face interim resistance around 10,070, 10,360, 10,600, 10,830 and 11,050 levels.
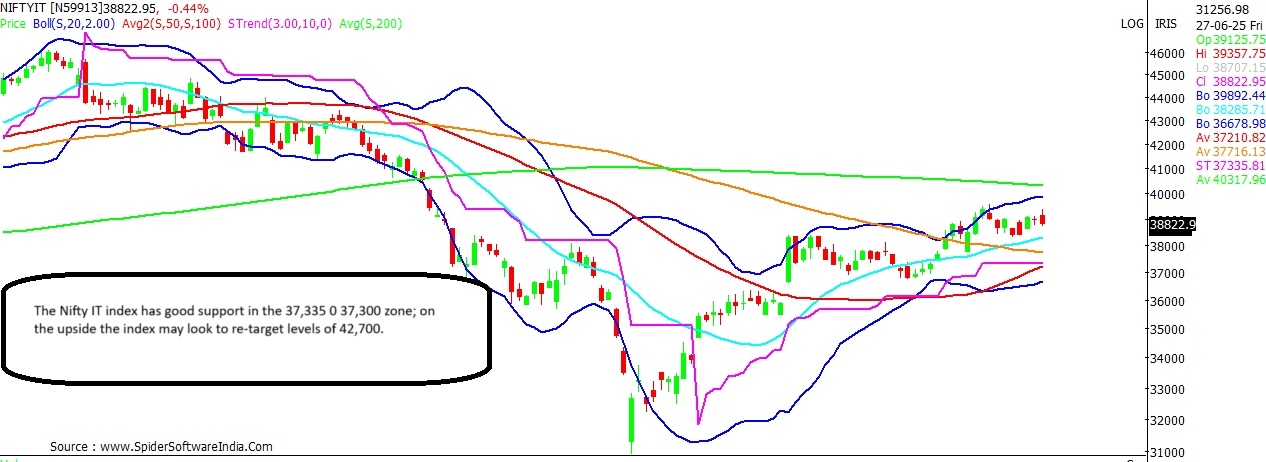
ALSO READ | Nifty IT worst performer so far in 2025, drops 10%; time to bottom fish? Nifty IT
Last close: 38,822
Upside Potential: 10%
Support: 37,335; 37,200
Resistance: 39,500; 40,300
Even as the
Nifty IT index is down more than 10 per cent thus far in 2025, the technology-led index has surged more than 27 per cent from its nadir at 30,919 hit on April 7, 2025. The index has been making higher-highs and higher-lows on the daily chart, and also given a weekly breakout earlier this month.
CLICK HERE FOR THE CHART Thus, the IT index may aim to recover further ground going ahead. Chart suggests that the near-term bias is likely to remain positive as long as the index holds above 37,335 - 37,200 levels. On the upside, the index may counter stiff resistance around its 200-Day Moving Average (200-DMA), which stands at 40,300 levels; with interim resistance seen at 39,500 levels.
Break and sustained trade above 40,300 holds the key for further recovery. As such, the Nifty IT index can potentially zoom to 42,700 levels.
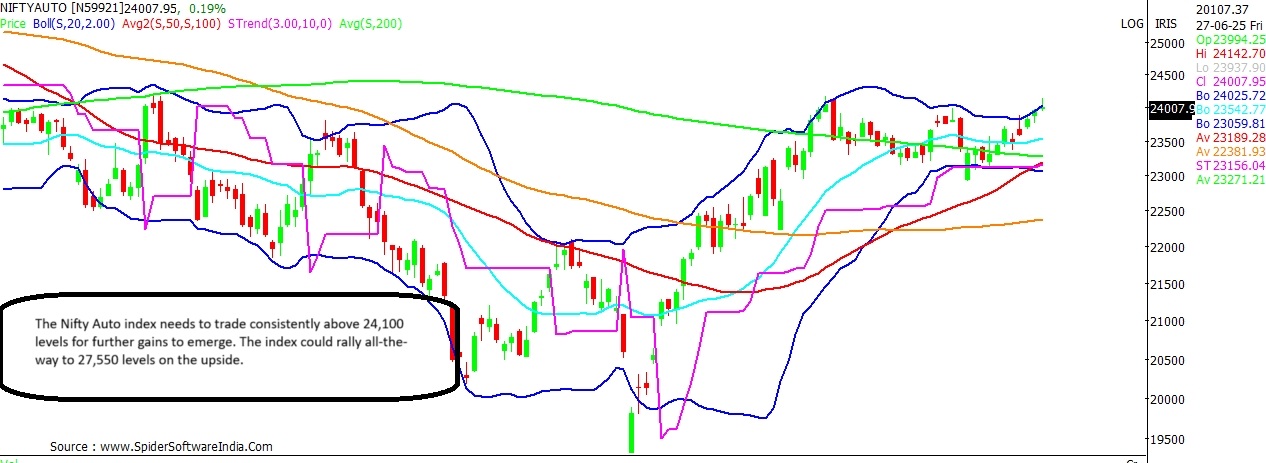
Nifty Auto
Last close: 24,008
Upside Potential: 14.8%
Support: 23,600; 23,150; 22,900; 22,600
Resistance: 24,600; 25,200; 26,300; 26,700
The
Nifty Auto index has surged over 24 per cent from its April low, and is now seen testing resistance around the higher-end of the Bollinger Bands on the daily chart around the 24,000-mark.
CLICK HERE FOR THE CHART Technical chart suggests that the index needs to quote consistently above 24,100 levels for further gains to emerge. On the upside, the Auto index can potentially rally to 27,550 levels, with interim resistance likely around 24,600, 25,200, 26,300 and 26,700 levels.
In case of a dip, the Nifty Auto index may seek support around 23,600, 23,150, 22,900 and 22,600 levels.
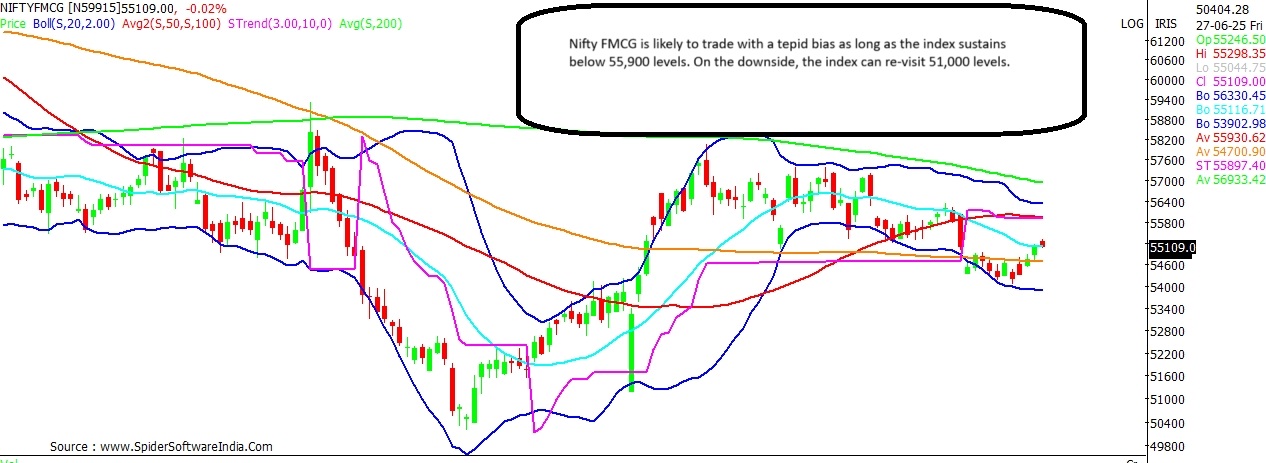
ALSO READ | Top 10 midcap, smallcap stock ideas from Bernstein that are screaming buy Nifty FMCG
Last close: 55,109
Upside Potential: 5.6%
Downside Risk: 7.5%
Support: 54,700; 54,500; 52,850; 52,650
Resistance: 55,900; 56,500
The
Nifty FMCG index is seen trading with a tepid bias across time-frames. Chart suggests that the near-term bias is likely to remain negative as long as the index sustains below 55,900 levels; above which a key hurdle exists at 56,500 levels.
CLICK HERE FOR THE CHART In case, the FMCG index manages to clear this resistance zone, it can potentially advance to 58,200 levels, wherein exists the medium-term trend line hurdle - a key technical indicator the index has been struggling below since October 2024.
For now, near support for the index lies in the 54,500 - 54,700 range. Break of the support zone can potentially trigger a slide back towards 51,000 levels, with interim support anticipated around 52,850 and 52,650 levels.
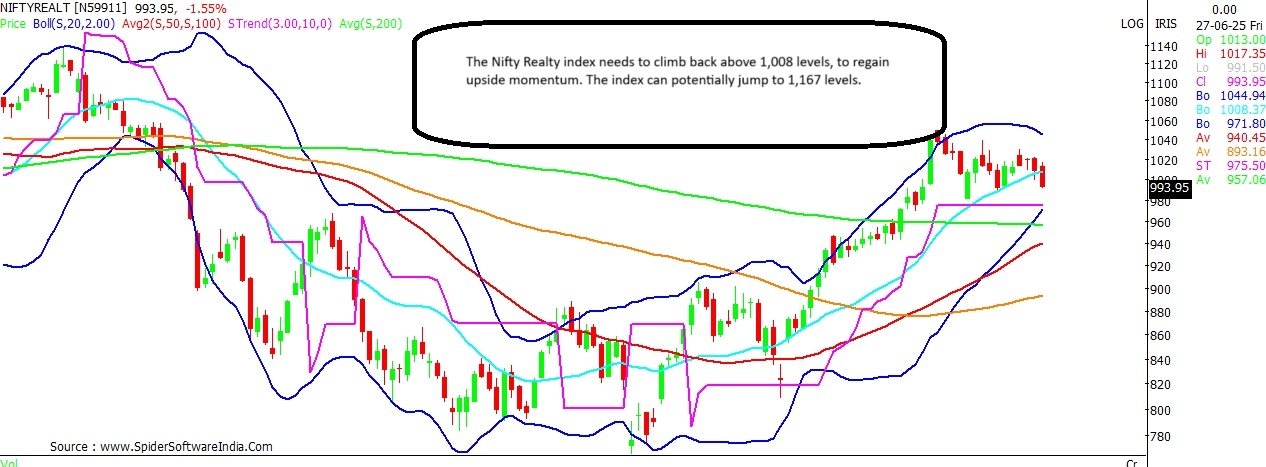
Nifty Realty
Last close: 994
Upside Potential: 17.4%
Downside Risk: 15.5%
Support: 975; 943; 910; 890
Resistance: 1,045; 1,100; 1,140
The
Nifty Realty index is seen quoting close to its trend line support, which stands at 975 levels. As long as the index holds above the same, the bias is likely to be cautiously optimistic. Break and trade below the same, can trigger a fall towards 840 levels, with interim support likely around 943, 910 and 890 levels.
CLICK HERE FOR THE CHART On the upside, the index needs to climb back above its 20-DMA, which stands at 1,008 for the sentiment to turn favourable. Sustained trade above the same can potentially trigger a rally towards 1,167 levels. Intermediate resistance can be expected around 1,045, 1,100 and 1,140 levels.
 "Can Nifty hit 30,000 in H2 2025? Buy or sell FMCG, Auto stocks? Chart check")


